Fig. 1.

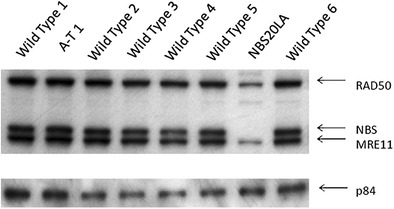
Immunoblot allows comparison of nibrin (NBS), MRE11 and Rad50 protein levels in an NBS cell line (NBS20LA) to wild type and AT cells. Note absence of nibrin in NBS LCL. Protein loading control was p84

Immunoblot allows comparison of nibrin (NBS), MRE11 and Rad50 protein levels in an NBS cell line (NBS20LA) to wild type and AT cells. Note absence of nibrin in NBS LCL. Protein loading control was p84