
Fig. 2.
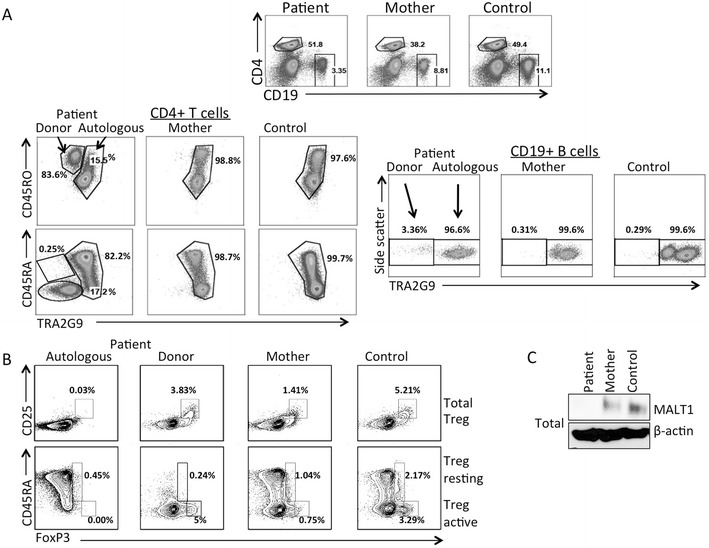
a, Flow cytometry of PBMCs from the patient, mother and a healthy control, using the TRA2G9 antibody to separate patient autologous cells expressing HLA-C*01/*03/*04:01/*14:02 from donor-derived cells expressing *08:01, *07:02. Left panels, naïve CD4+, CD45RA or CD4+ CD45RO+ T cells; right panels, CD19 B cells. b, Upper panels, total Treg cells (CD25+, FoxP3+); lower panels, resting (CD45RA+, FoxP3+) and active (CD45RA-, FoxP3+) Treg cells in PBMCs from patient autologous and donor populations, the mother; and a healthy control. c, MALT1 protein expression in total cell lysates isolated from PBMCs from the patient autologous cells, maternal cells and cells from a healthy control. Beta-actin was used as a loading control. All data representative of 3 independent experiments