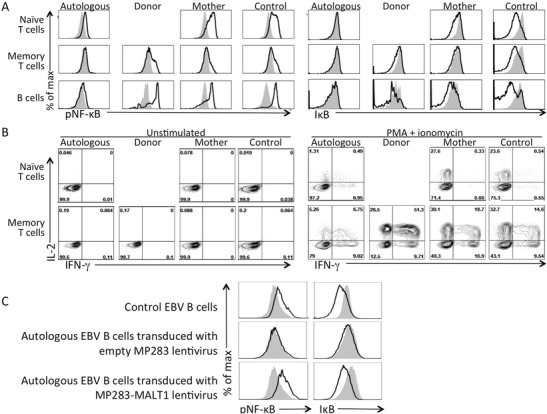
Fig. 3.

a, Intracellular phospho-NF-κB and IκB in gated unstimulated (gray shading) vs. PMA and ionomycin stimulated (black line) naïve and memory CD3+ T cells and CD19+ B cells from the patient, including patient autologous (TRA2G9+) and donor-derived (TRA2G9-) cells; also analyzed were cells from the mother and a healthy control. b, T cell expression of intracellular IL-2 (y-axis) and IFN-γ (x-axis) without (left panels) and with (right panels) PMA plus ionomycin stimulation. c, Analysis of NF-κB phosphorylation and IκB degradation without (gray shading) or with (black lines) stimulation with PMA and ionomycin. Upper panels, control EBV B cells; middle panels, patient autologous EBV B cells transduced with empty MP283 lentivirus; bottom panels, patient autologous EBV B cells transduced with MP283-MALT1 lentivirus. All data representative of 3 independent experiments
