
Figure 1.
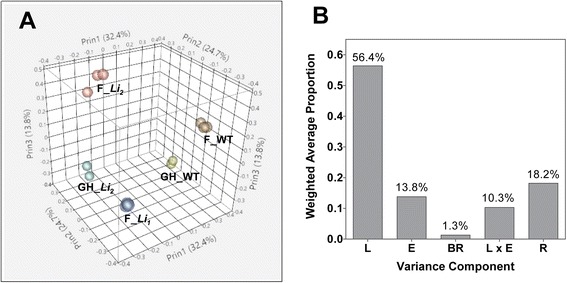
Sources of variability in RNA-seq data. (A) Principal component analysis of RNA-seq samples from developing fibers (at 8 DPA) of Li 1, Li 2 and WT NILs. F: field grown plants; GH: greenhouse grown plants. (B) Proportion of the transcriptional variance explained by each variance component. L: near-isogenic lines, Li 1, Li 2 and WT; E: environmental factors, greenhouse and field; BR: biological replicates; and R: residual.