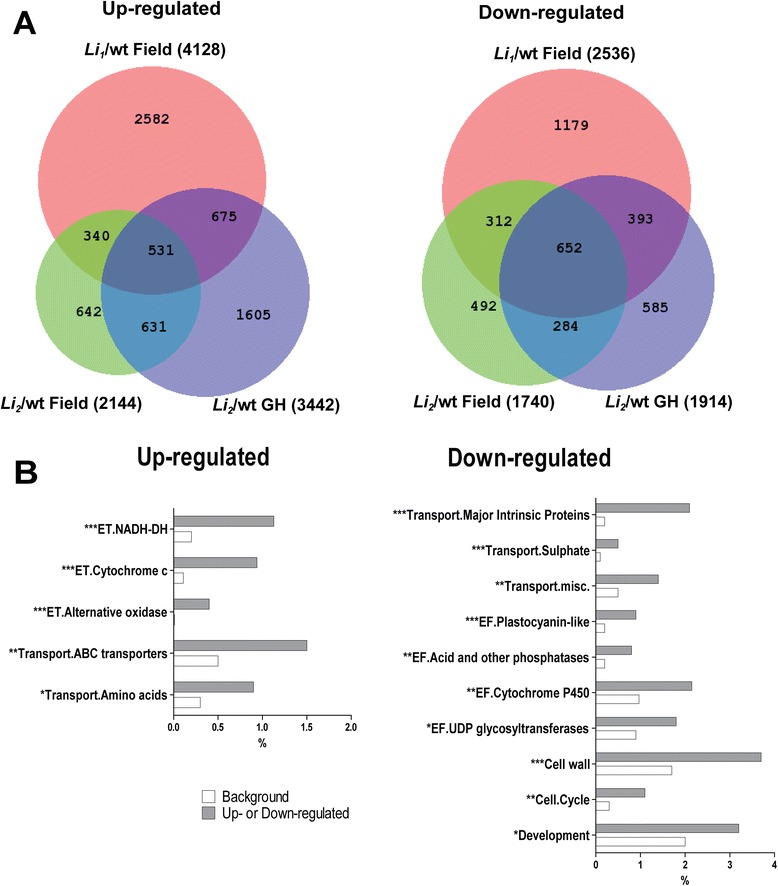
Figure 2.

Overview of differentially expressed genes in developing fibers of mutants comparing with WT under different growth conditions. (A) Venn diagrams of significantly up-regulated genes (left) and down-regulated genes (right) in Li 1/wt and Li 2/wt grown in field and greenhouse (GH). Total number of significantly regulated genes in each comparison is indicated in parentheses. (B) Gene set enrichment analysis of common regulated genes among short fiber mutants grown in field and greenhouse. As indicated in section (A) of this figure there are 531 up-regulated and 652 down-regulated common genes. MapMan BIN structure was used for functional categorization of common regulated genes. Shown are only the significantly overrepresented subcategories; the number of asterisks indicate the level of significance (i.e. *p < 0.05, **p < 0.001). Relative gene frequencies in functional categories are presented in percents from amount of up-regulated or down-regulated genes; background represents pseudo-G. hirsutum genome generated by doubling the reference G. raimondii genome. Abbreviations: ET, electron transport; and EF, miscellaneous enzyme families.
