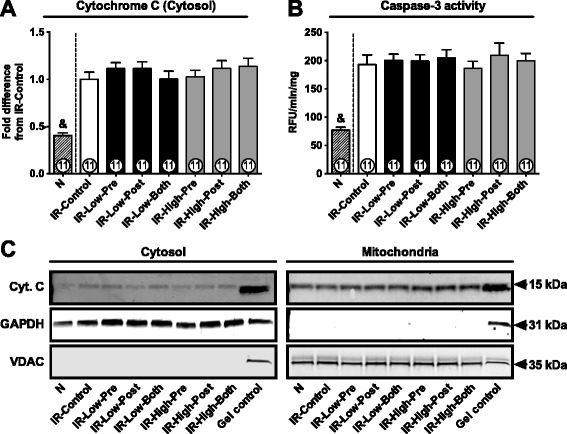
Figure 4.

Cytosolic cytochrome C and caspase-3 activity. A: Cytochrome C abundance in cytosol. B: Proteolytic activity of caspase-3. RFU/min/mg, relative fluorescence unit/minute/mg protein. C: Original representative western blots of cytochrome C (Cyt. C). GAPDH and VDAC were used as cytosolic and mitochondrial loading controls, respectively. A heart homogenate sample was used as gel internal control. Data are shown as mean ± SE. &, p < 0.05 vs. all other groups.
