
Figure 1.
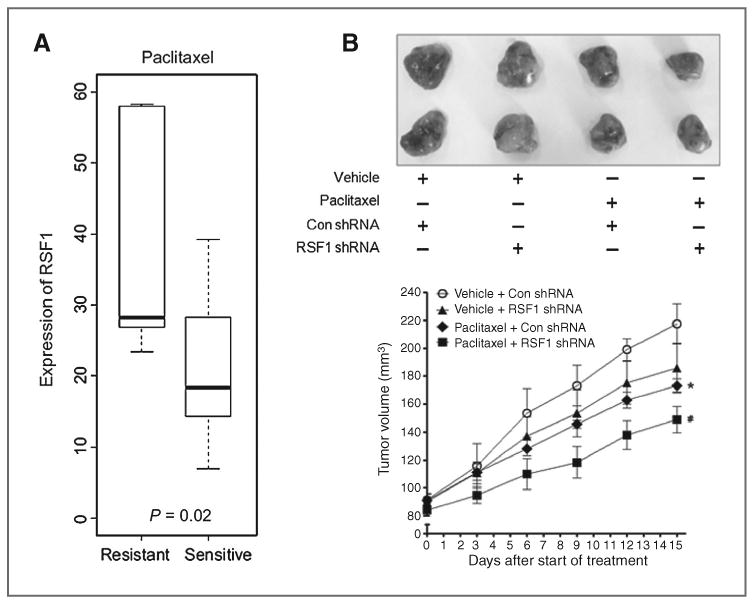
RSF1 expression and response to paclitaxel in patients with ovarian cancer and mouse xenograft models. A, expression level of RSF1 in patients with ovarian cancer in the CTCR-OV01 trial cohort. P values were determined by the Student t test. Horizontal lines, medians, boxes extend from the 25th to 75th percentiles, and error bars extend to the 10th and 90th percentiles. B, intratumoral administration of RSF1 shRNA (10 μg/kg) or control shRNA (Con shRNA; 10 μg/kg) was followed by intraperitoneal injections of paclitaxel (10 mg/kg) or same volume of vehicle. shRNA and paclitaxel were injected everyday for 14 days. Tumor sizes, relative mean volume ± SD. *, P < 0.05 compared with the vehicle treatment group with control shRNA. #, P < 0.05 compared with the paclitaxel treatment group with RSF1 shRNA.