
Figure 1.
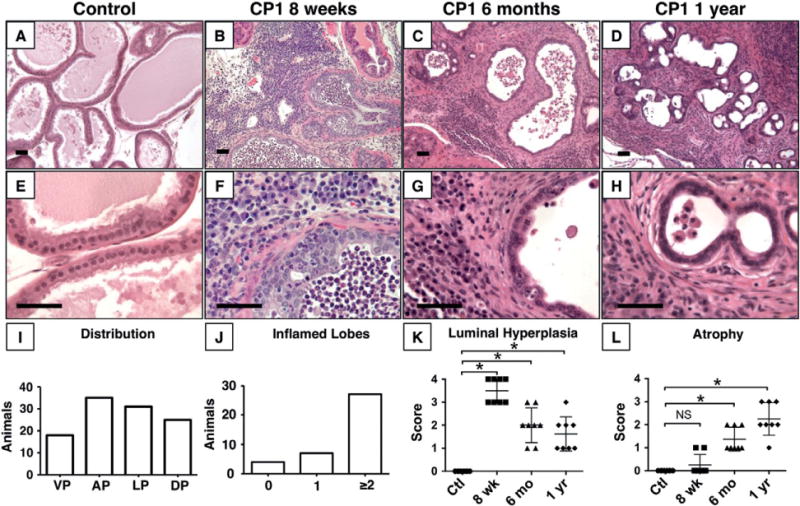
CP1 induces chronic prostatitis. Representative images of prostate glands after control saline treatment (A, E) or CP1-induced inflammation at 8 weeks (B, F), 6 months (C, G), and 1 year (D, H) after infection show sustained inflammation. (I) Distribution of inflammation by individual lobe (N =38). DL = dorsal; AP = anterior; LP = lateral; VP = ventral. (J) Total number of inflamed lobes per mouse (N =38). (K) Luminal hyperplasia score is significantly increased at 8 weeks, 6 months, and 1 year after inoculation compared with saline-treated controls (p < 0.001, n =8 per group). (L) Atrophy score is significantly increased at 6 months and 1 year after inoculation compared with saline-treated controls (p < 0.001, n =8 per group). Scale bar =50 μm.