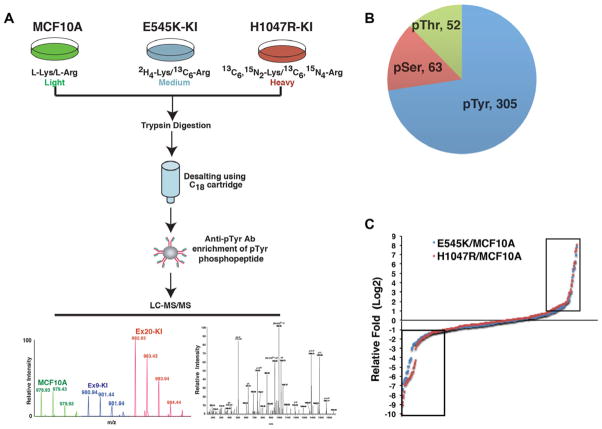
Figure 1.
Phosphoproteomic analysis of PIK3CA E545K and H1047R isogenic knock in cell lines. (A) A schematic depicting the strategy used for quantitative phosphoproteomic profiling of MCF10A parental, E545K, and H1047R knock in cells. (B) Number of phosphotyrosine (pTyr) phosphoserine (pSer) and phosphothreonine (pThr) sites identified in the study. (C) Distribution of log 2 ratio of phosphopeptide intensities identified in E545K (blue) or H1047R (red) cells vs. MCF10A cells. The dots inside the two boxes represent peptides with phosphorylation altered more than twofold in E545K or H1047R cells comparing to MCF10A cells. Left: hypophosphorylation, right: hyperphosphorylation.

