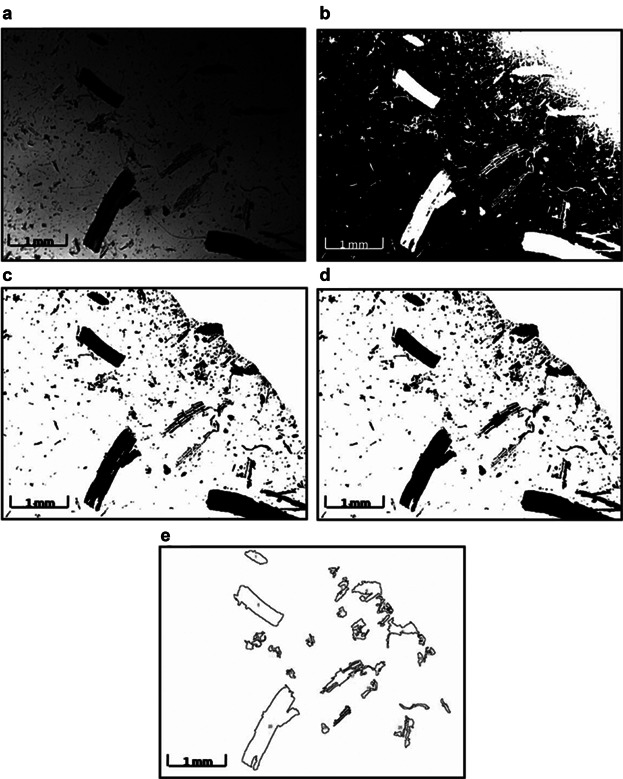
Figure 3.

Methodology for root debris size analysis. Light microscopic images were taken at 2.5× magnification for individual samples at each time point. Image J software was used to analyse particle sizes. a–e represents the flow diagram of the image processing algorithm for the analysis. a: A raw image of root debris post-shearing for 240 s, converted to greyscale. b: A thresholded binary image with the particles in white against a black background. c: Using the Freemanual selection tool, the area for analysis has been selected, clearing any shading (here the top right hand corner of the image) caused by shadows of the microscope lens' outer edge, and the image inverted. The particles appear black against a white background. d: Apparent holes or gaps within the root pieces have been filled using the Binary option of the software. e: Using a measured calibration factor of 144 pixels mm−1, only root particles of projected area greater than 0.01 mm2 were measured, assuming that anything less than this was likely to be adventitious debris and dust, and the feret function (defined by the software as the longest distance between any two points along the selection boundary), considered to be the fragment length.
