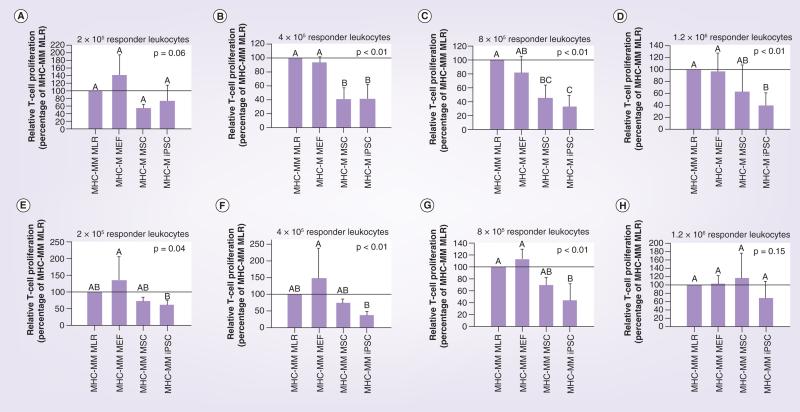
Figure 5. Immunomodulatory potential of mouse embryoinc fibroblasts, mesenchyamal stem cells and induced pluripotent stem cell as determined using modified one-way mixed leukocyte reactions in which MHC-mismatched leukocytes were cultured in the presence or absence of these cells.
Data are reported as the relative T-cell proliferation, which was calculated as the percentage proliferation of the MHC-mismatched MLR alone. MLR results as shown in Figure 4 are displayed here for MHC-matched cells (A–D) and MHC-mismatched cells (E–H) at the different responder leukocyte concentrations tested. Bars represent mean ± SD from a total of three separate experiments performed with multiple cell lines. Reference lines have been placed at 100% to denote the positive control of the MHC-mismatched MLR. Superscript letters indicate significant differences between groups by ANCOVA, with experiment as a covariate, followed by a Tukey multiple comparisons test, p ≤ 0.05. iPSC: Induced pluripotent stem cell; MEF: Mouse embryonic fibrobast; MHC-M: MHC-matched; MHC-MM: MHC-mismatched; MLR: Mixed leukocyte reaction;
MSC: Mesenchymal stromal cell.

