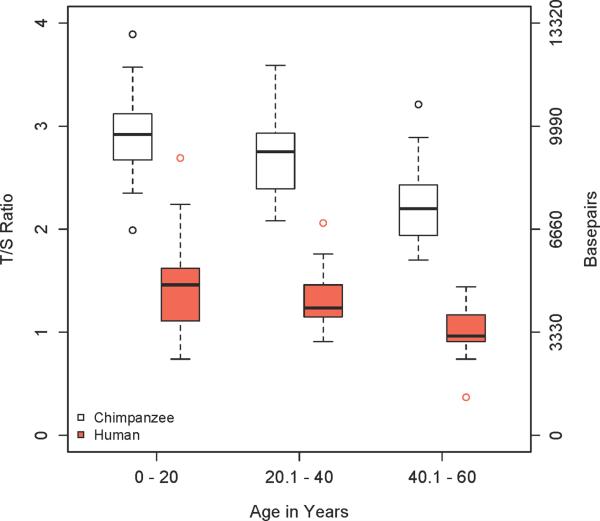
Fig. 2.
Modified box plots of TL variation when each species is separated into three age cohorts of 20 years. Whiskers represent 1.5× IQD and any data points outside of these maximal values are plotted; the top of the box signifies the 3rd quartile/75th percentile and the bottom of the box signifies the 1st quartile/25th percentile; the dark line is the median. Bp values on the right vertical axis were calculated using the conversion factor of 3,330 from Cawthon (2009) (METHODS section). Measurements were calculated across individuals.

