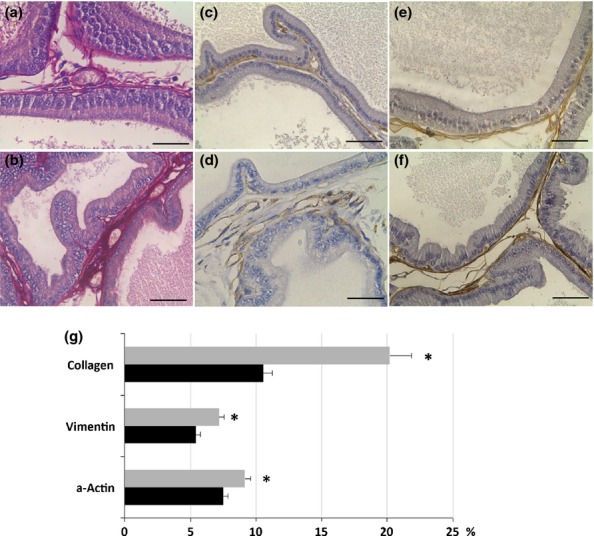
Figure 2.

Distribution of collagen (a, b), vimentin (c, d) and α-actin (e, f) in the ventral prostate of control (a, c, e) and obese rats (b, d, f). (g) Relative frequency (%) of these parameters in the ventral prostate of control (black bars) and obese rats (grey bars). There is a notable increase in collagen, fibroblasts (vimentin), smooth muscle cells (α-actin) in the prostate of animals treated with a high-fat diet. The values are presented as Mean ± standard deviation. Student's t-test *P < 0.05. Scale bars: 50 μm
