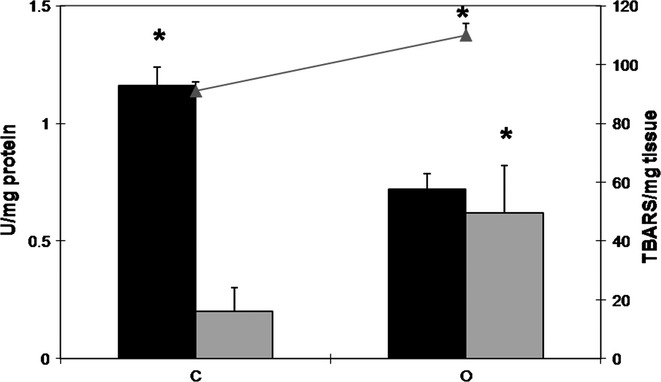
Figure 6.

Activity of catalase (black bars) and GST (grey bars) (U/mg protein; black bars) and MDA levels (grey line- TBARS/mg tissue) in the ventral prostate extracts of control (C) and obese (O) rats. The values are presented as mean ± standard deviation. Mann–Whitney's U-test, *P < 0.05. Five animals per group were used for each biomarker of oxidative stress.
