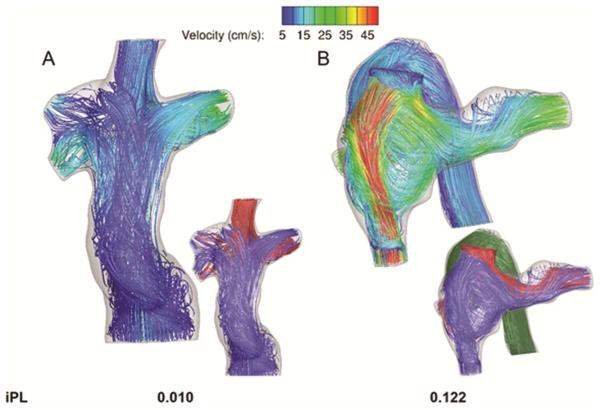
Figure 2.
Representative output for computational fluid dynamics simulations showing time averaged velocity streamlines and iPL for the A) lowest and B) highest power loss patients from among the patients analyzed. In the larger figures, the streamlines are color-coded by local velocity magnitude, while the streamlines in the inset images are color-coded by vessel of origin: red- superior vena cava; blue- inferior vena cava; green- azygos vein.

