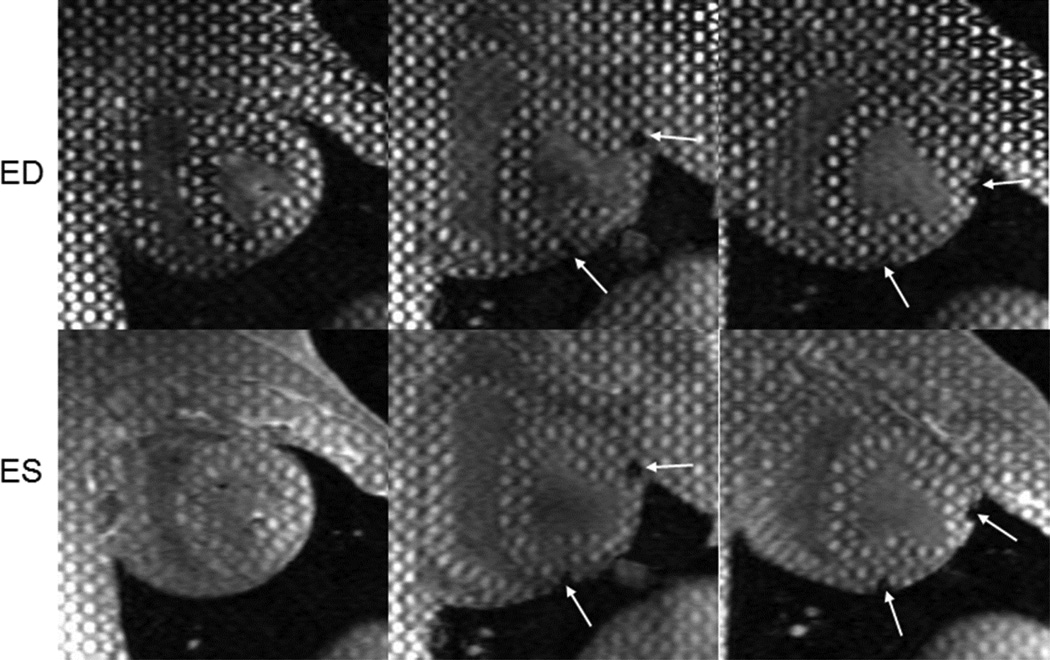
Figure 2. Tagged images of left ventricular (LV) remodeling following MI.
Short-axis mid-ventricular images acquired at baseline (left), 1-week (middle), and 4-weeks (right) after infarct. End-diastolic (ED) images (top row) show the change in LV size and geometry with infarct progression. Regional tag deformation at end-systole (ES) are shown for the three time points in the bottom row. Infarct region is delineated using markers which create signal voids (arrows).

