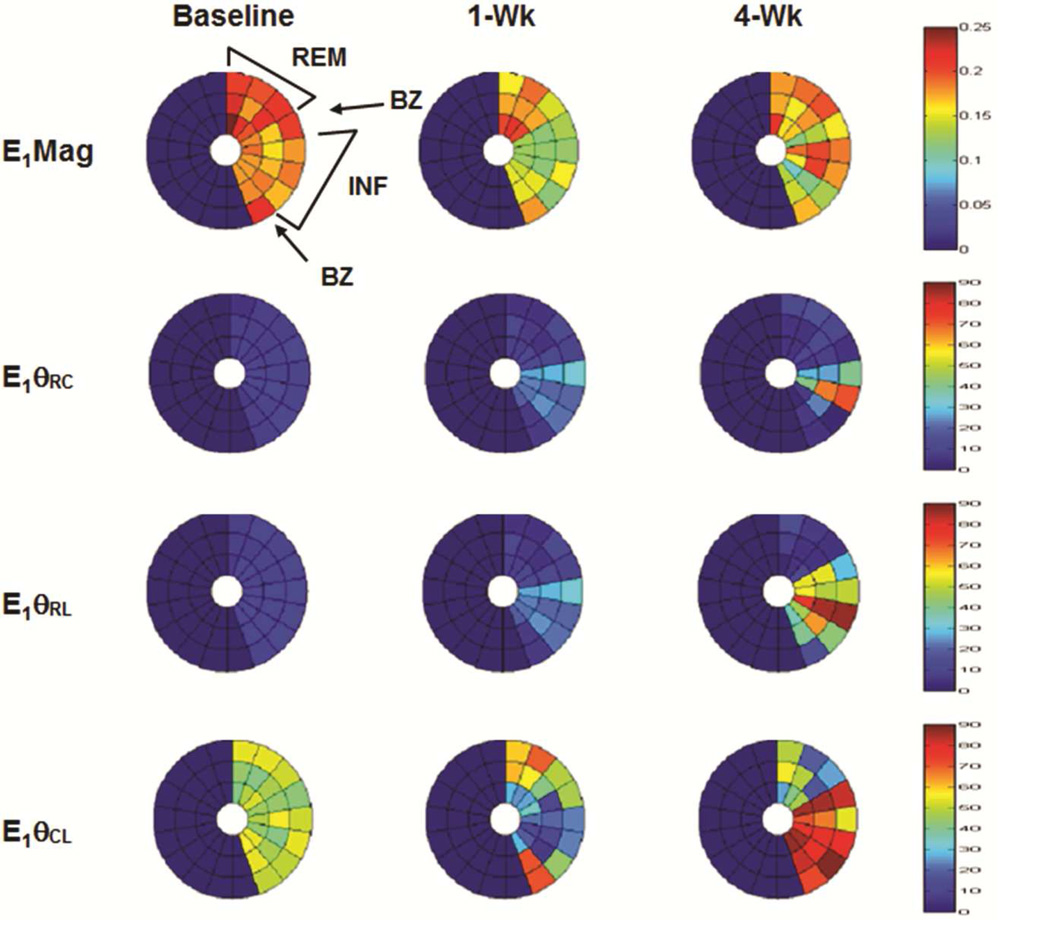
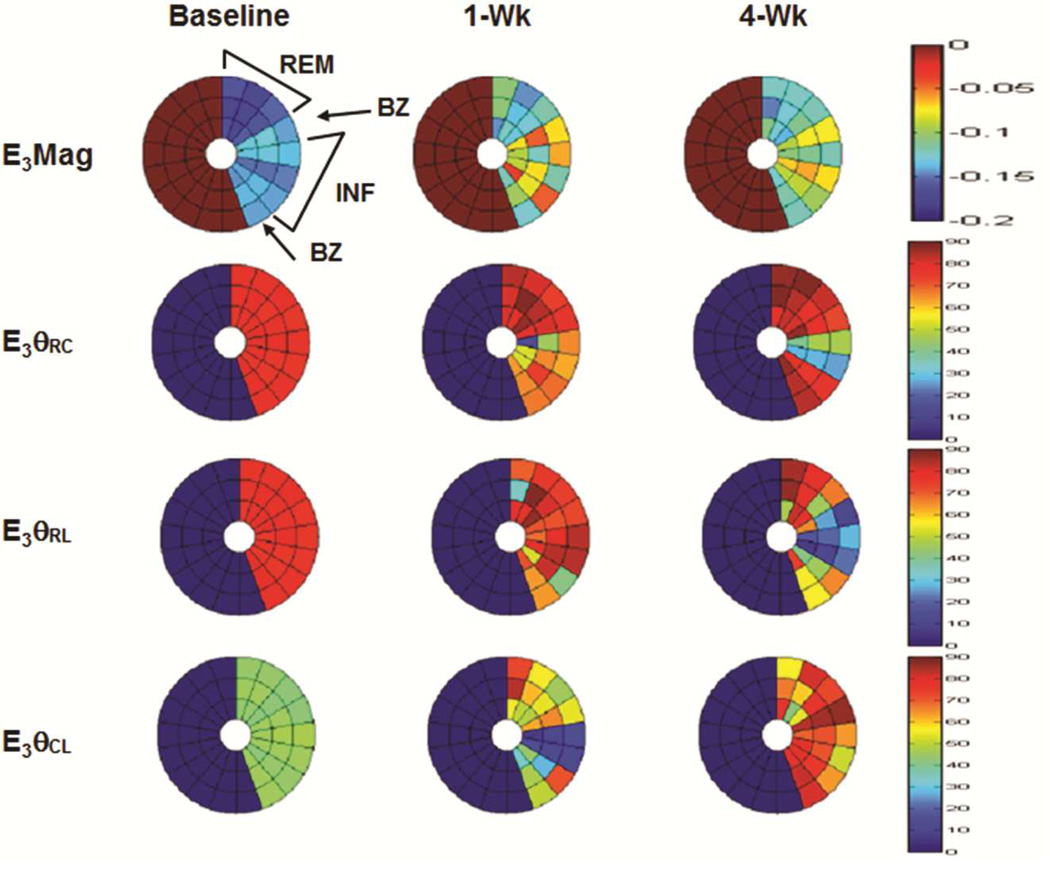
Figure 5. Bulls-eye plots of maximum (E1) (A) and minimum (E3) (B) principal strain at baseline, one week (1-Wk) and four week (4-Wk) post-infarct for a representative animal.
Plots display three mid-ventricular slices from apex (inner) to base (outer) for remote (REM), border zone (BZ), and infarct (INF) regions. E1 magnitude (E1Mag) decreases in all regions at 1-Wk but increases at 4-wks in the infarct. Infarct E1 vectors (E1θRC, E1θRL) shift from radial direction at baseline to more circumferential/longitudinal signifying decreased wall thickening and increased tissue stretch. Circumferential shortening (E3Mag) decreases in all regions as the LV remodels while infarct E3 vectors shifts (E3θRC, E3θRL) from circumferential/longitudinal to a more radial direction indicating tissue stretch.


