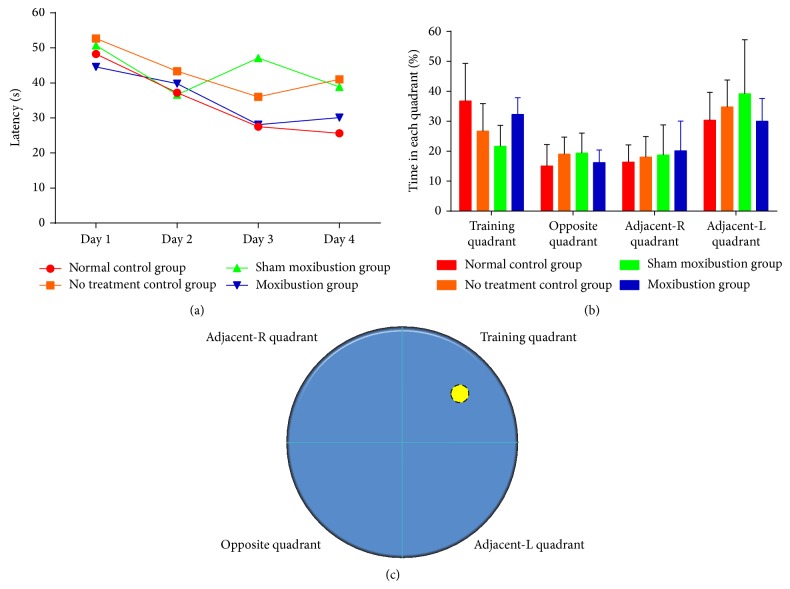
Figure 3.
The performance of 4 groups in Morris water maze task. (a) Each point represents group mean latency (s) to reach the hidden platform in four groups during visible platform training. (b) Bar chart shows the percentage of time spent in each quadrant within 60 s during absence platform spatial memory test. (c) The Morris water maze pool is divided into 4 quadrants. The yellow circle represents the platform which is placed in training quadrant.

