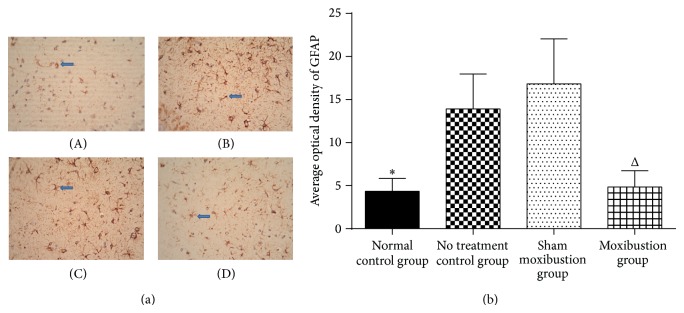
Figure 4.

Hippocampus glial fibrillary acidic protein. (a) The pictures reflect the expression of GFAP in 4 groups (original magnification ×400). (A) represents normal control group (4.33 ± 1.52), (B) represents no treatment control group (13.90 ± 4.06), (C) represents sham moxibustion group (16.82 ± 5.23), and (D) represents moxibustion group (4.85 ± 1.89). Blue arrows identify examples of clusters of GFAP positive cells. (b) Bar graph represents GFAP immunoreactivity in the hippocampus CA3. * P < 0.05 versus no treatment control group; Δ P < 0.05 versus sham moxibustion group.
