
Figure 5.
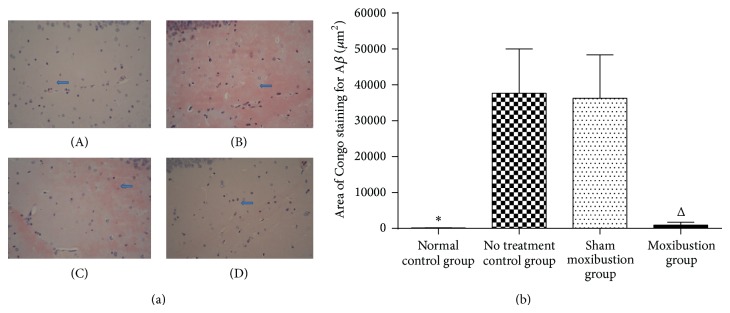
Hippocampus β-amyloid plaque. (a) The pictures reflect the β-amyloid plaque expression in 4 groups under Congo red straining (original magnification ×400). (A) represents normal control group (101.25 ± 82.68), (B) represents no treatment control group (37661.70 ± 12349.53), (C) represents sham moxibustion group (36281.30 ± 12104.97), and (D) represents moxibustion group (947.70 ± 768.70). β-Amyloid appears as a cloud mass and shows strongly Congo red positive (B, C). (b) The graph shows different levels of β-amyloid; thus it can be seen that normal control group got less area of Congo staining for β-amyloid than that of no treatment control group. Same situation occurs between sham moxibustion group and moxibustion group. * P < 0.05 versus no treatment control group; Δ P < 0.05 versus sham moxibustion group.