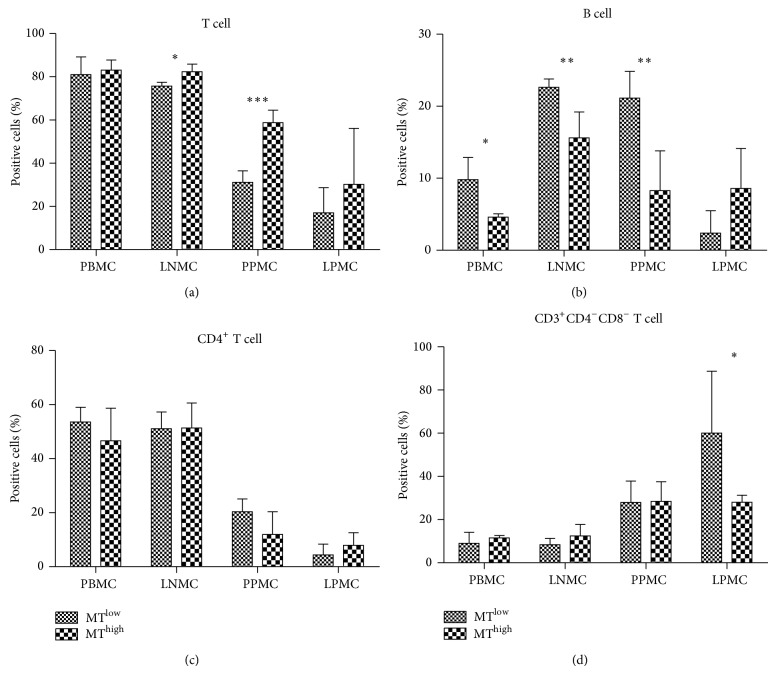
Figure 2.
Comparison of the percentages of T cells and B cells at different sites in the microbial translocation (MT)high and MTlow groups. (a) T cells, (b) B cells, (c) CD4+ T cells, and (d) CD3+CD4−CD8− T cells of peripheral blood mononuclear cells (PBMCs), lymph node mononuclear cells (LNMCs), Peyer's patches mononuclear cells (PPMCs), and lamina propria mononuclear cells (LPMCs) were compared between the MThigh and MTlow groups of monkeys. The column bar indicates the mean of the ratio of target cells (lymphocytes in (a) and (b); T cells in (c) and (d)). Error bars and individual standard deviations (SD) are shown. * P ≤ 0.05, ** P ≤ 0.01, and *** P ≤ 0.001 as calculated by two-sided nonparametric Mann-Whitney U test.

