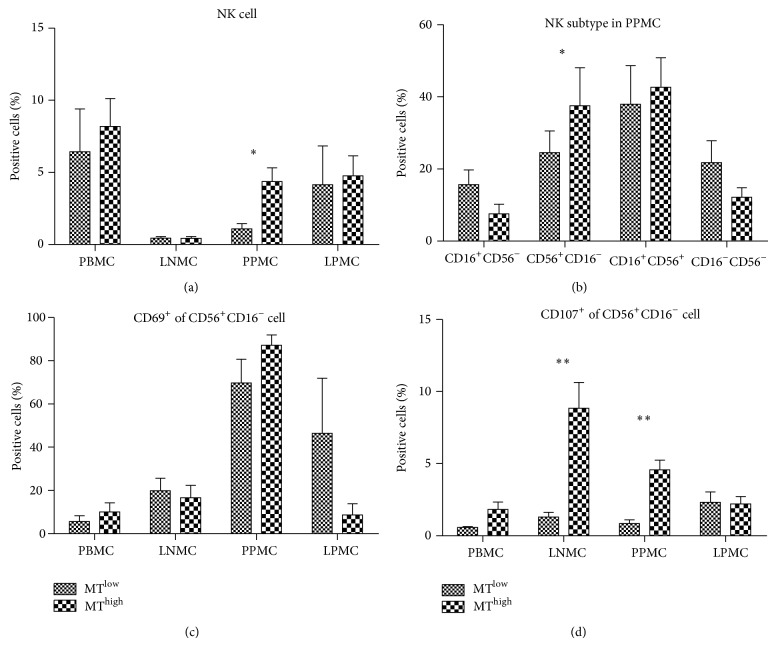
Figure 3.
Numerical, phenotypical, and functional analyses of natural killer (NK) cells and the subtypes of different tissues from the microbial translocation (MT)high and MTlow groups. (a) Distribution of macaque NK cell subsets in blood and tissues from the MThigh and MTlow groups. (b) NK cell subtype in Peyer's patches mononuclear cells (PPMCs) of the MThigh and MTlow groups. (c) Expression of CD69 and (d) CD107a molecules on CD56+ NK cell subsets of the MThigh and MTlow groups. The column bar indicates the mean of the ratio of target cells (mononuclear cells in (a); NK cells in (b); CD56+CD16− NK cells in (c) and (d)). Error bars and individual standard deviations (SD) are shown. * P ≤ 0.05 and ** P ≤ 0.01 as calculated by two-sided nonparametric Mann-Whitney U test.

