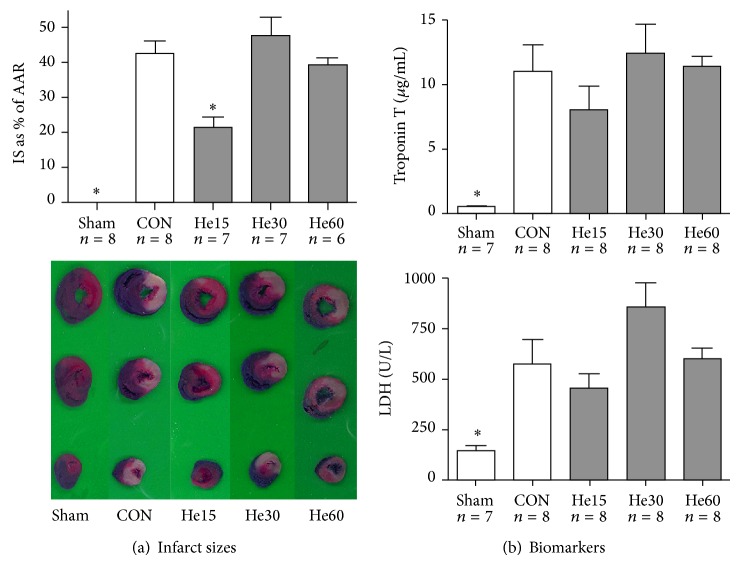
Figure 1.
Infarct size and biomarkers after 120 minutes of reperfusion. Data are shown as mean ± S.E.M. * P < 0.05 versus CON. Amount of experiments in each group is shown below individual bars. (a) Infarct sizes as percentage of the area at risk. Underneath the graph, pictures of representative slices of myocardium are shown for each group. (b) Troponin T and LDH levels in the circulation after 120 minutes of reperfusion.

