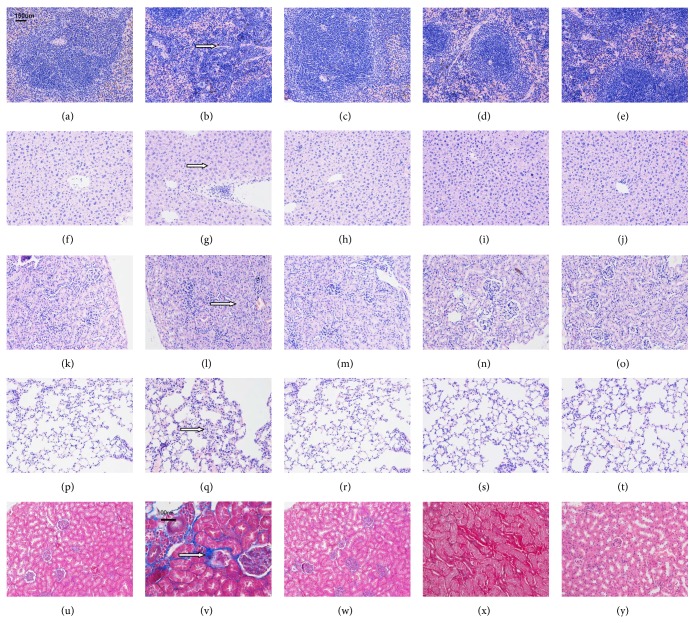
Figure 3.
(a–e) Spleen H&E staining (200x magnification). (a) C57BL/6 mouse normal control group. (b) B6.Fas mouse model group. The arrow indicates megakaryocytes. (c) B6.Fas mouse low-dose group. (d) B6.Fas mouse medium-dose group. (e) B6.Fas mouse high-dose group. The B6.Fas mouse model group displayed visible hemosiderin staining, which improved after treatment. (f–j) Liver H&E staining (200x magnification). (f) C57BL/6 mouse normal control group. (g) B6.Fas mouse model group. The arrow shows necrotic liver cells. (h) B6.Fas mouse low-dose group. (i) B6.Fas mouse medium-dose group. (j) B6.Fas mouse high-dose group. The B6.Fas mouse model group displayed visible spots of necrotic liver cells, which improved after treatment. (k–o) Kidney H&E staining (200x magnification). (k) C57BL/6 mouse normal control group. (l) B6.Fas mouse model group. The arrow shows reduced renal cysts. (m) B6.Fas mouse low-dose group. (n) B6.Fas mouse medium-dose group. (o) B6.Fas mouse high-dose group. The B6.Fas mouse model group displayed slightly proliferative mesangial cells and reduced renal cysts, which improved after treatment. (p–t) Lung H&E staining (200x magnification). (p) C57BL/6 mouse normal control group. (q) B6.Fas mouse model group. The arrow shows inflammatory cell infiltration. B6.Fas mouse low-dose group. (s) B6.Fas mouse medium-dose group. (t) B6.Fas mouse high-dose group. The B6.Fas mouse model group displayed visible alveolar septal infiltration of inflammatory cells, which improved after treatment. (u–y) Renal Masson staining. (u) C57BL/6 mouse normal control group (200x magnification). (v) B6.Fas mouse model group (400x magnification). The arrow shows fibrosis of the tubulointerstitial renal cortex. (w) B6.Fas mouse low-dose group (200x magnification). (x) B6.Fas mouse medium-dose group (400x magnification). (y) B6.Fas mouse high-dose group (200x magnification). The B6.Fas mouse model group displayed slight fibrosis of the tubulointerstitial renal cortex, which improved after treatment. Arrows show the abnormal area.

