Figure 2.

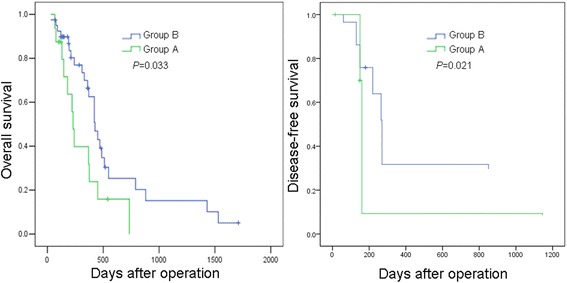
Overall survival and disease-free survival curves of group A and group B. Group B had significantly better overall and disease-free survival curves than group A (P = 0.033; P = 0.021).

Overall survival and disease-free survival curves of group A and group B. Group B had significantly better overall and disease-free survival curves than group A (P = 0.033; P = 0.021).