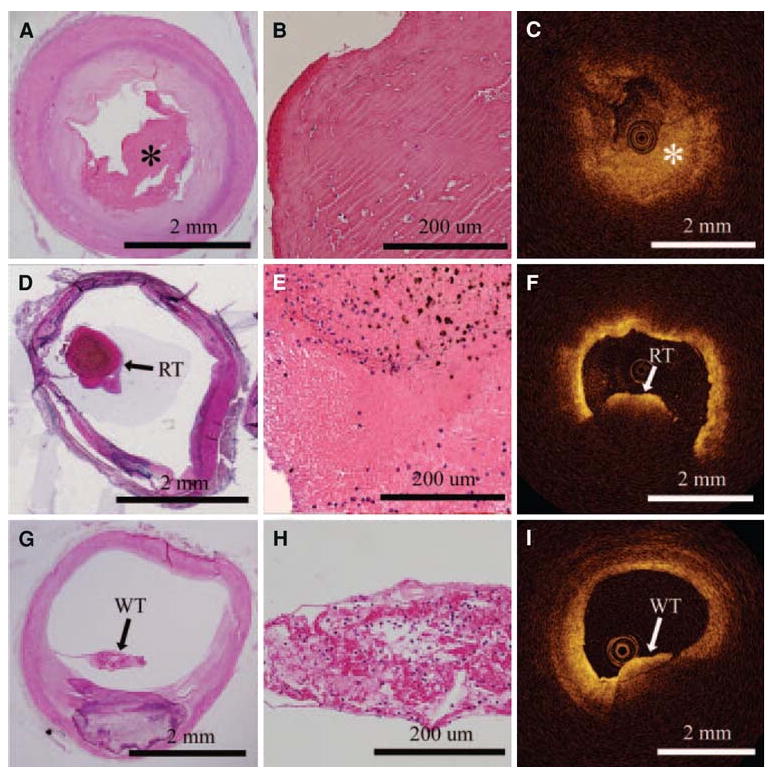
Figure 10.

OCT images on the right are correlated with histology images on the left. The top row shows a fibrous clot (asterisk), comprising fibrin and a few red blood cells. The middle row shows a red thrombus by histology, which is evident in the OCT image by the large shadow from the thrombus (light attenuation) that prevents visualization of the entire arterial wall. White thrombus, composed predominantly of platelets, is in the last row. White thrombus can be discriminated from the red thrombus in the OCT image since the entire thickness of the clot and arterial lumen can be seen behind the thrombus59.
