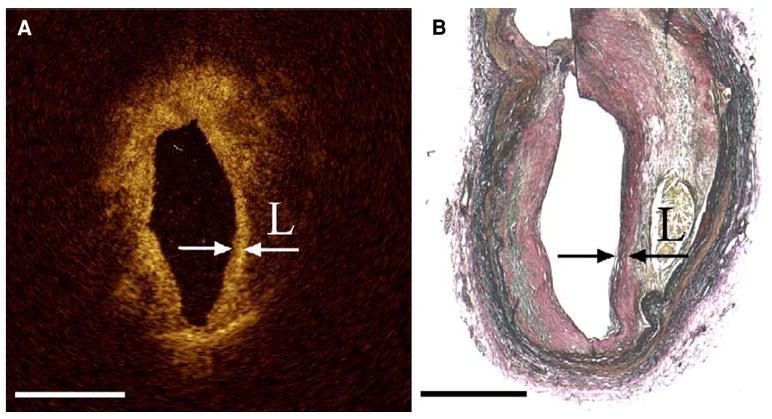
Figure 5.

(A) OCT image with arrows indicating the borders of a thin fibrous cap overlying a lipid pool with corresponding histology (B) Note that the “back wall” of the lipid core is poorly visualized with OCT due to light attenuation (Reproduced with permission from47).
