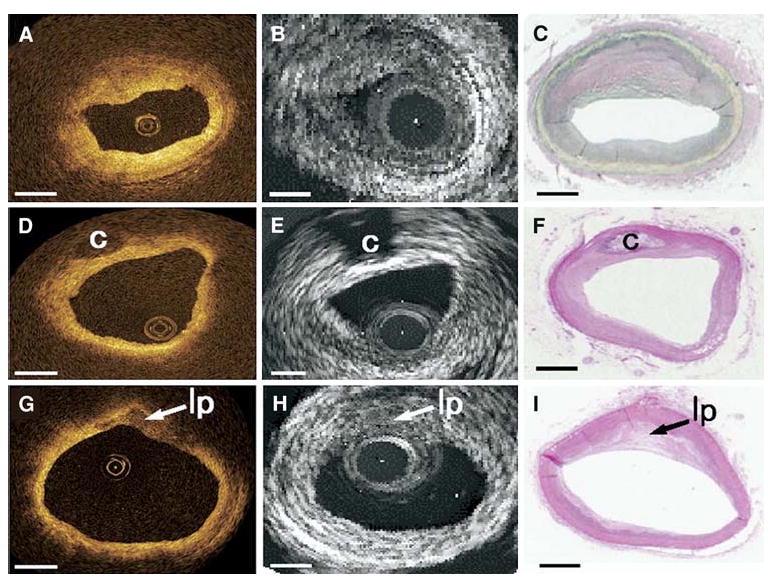
Figure 9.

Comparison of the three types of plaque (fibrous, fibrocalcific, and lipid-rich) as identified with OCT, IVUS, and histology. The top row shows homogeneous, signal-rich regions that characterize the fibrous plaque in OCT, which is difficult to differentiate with gray scale IVUS. The middle row shows a fibrocalcific plaque which appears as well-delineated signal-poor regions with sharp borders for OCT and bright echolucent regions in IVUS. Lipid-rich plaques are on the bottom row, which appear as signal-poor regions with diffuse borders on OCT and IVUS (Reproduced with permission from58).
