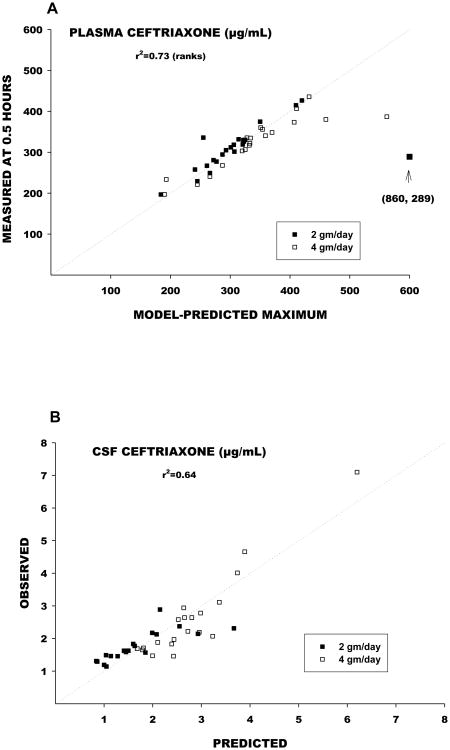
Figure 3.
A: The relation between maximum plasma concentrations for each individual patient as predicted by the model (x-axis) versus the actual measured plasma concentration at 0.5 hours, which in most cases was shortly after termination of the infusion. Notice that in essentially all cases the model correctly predicts the maximum. In a few cases, the model over predicts the maximum. B: Predicted and observed CSF concentrations.

