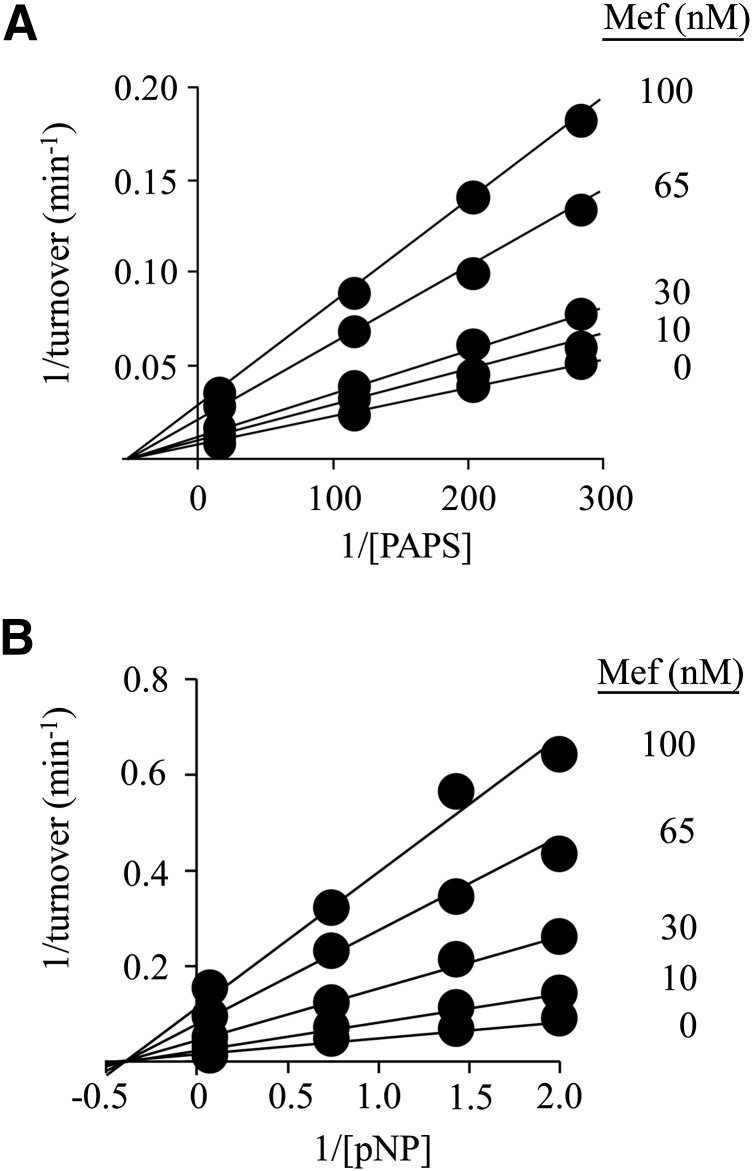
Fig. 4.
The inhibition of SULT1A1 by MEF. (A) MEF versus PAPS. Protocols were nearly identical to those associated with Fig 1, A and B. PAPS concentration was varied from 0.2 to 5 × Km, and MEF concentrations are listed in the figure. Reactions were initiated by addition of pNP at saturation (30 μM, 20 × Km), and reaction progress was monitored by following formation of 35S-pNPS. Velocities, obtained by least-squares fitting of four-point progress curves, were determined in duplicate, averaged, and the data were fit globally using a noncompetitive model. The fitting results are given by lines passing through the data. (B) MEF versus pNP. Reactions were initiated by addition of PAPS at saturation (10 μM, 625 × Km). The pNP concentration varied from 0.2 to 5 × Km, and MEF concentrations are given in the figure. Reaction progress was monitored at 405 nm. Less than 5% of the concentration-limiting substrate consumed at the endpoint of the reaction was converted during the measurement. Each point represents the average of three independent determinations. The lines through the points represent the behavior predicted by a global fit using a noncompetitive inhibition model. Reaction conditions for both panels are as follows: SULT1A1 (5.0 nM, dimer), MgCl2 (5.0 mM), and NaPO4 (50 mM), pH = 7.2, and T = 25 ± °C.

