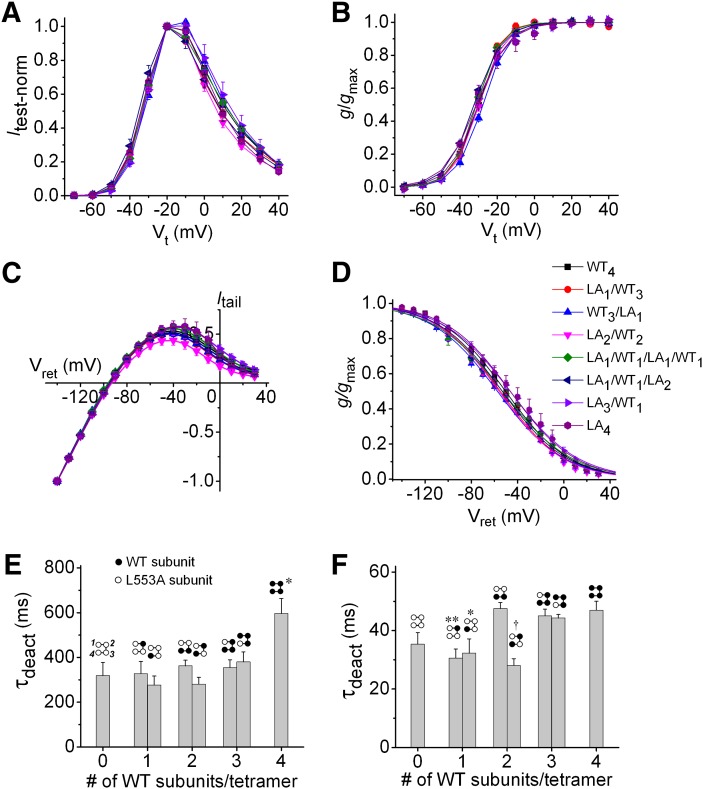
Fig. 2.
Biophysical properties of concatenated hERG1 channels. (A–D) Normalized Itest-Vt relationships (A), voltage dependence of activation (B), fully activated Itail-Vret relationships (C), and voltage dependence of inactivation (D) for LAn/WT4-n tetrameric hERG1 channels. To adjust for variable channel expression in oocytes, currents were normalized to peak currents measured at −20 mV (A), peak Itail (B), Itail at −140 mV (C), and to extrapolated peak (D). Symbol legend in (D) refers to (A–D) (n = 4–7). In (B and D), smooth curves represent best fits of data to a Boltzmann function. Values of V0.5 and z for activation and recovery from inactivation are presented in Tables 1 and 2, respectively. (E) Plot of τdeact measured at −70 mV as a function of the number of WT subunits contained in a concatenated tetramer (n = 4–11). *P < 0.05 compared with all other tetramers (one-way analysis of variance). Diagram located above each bar in the graph indicates positioning of WT and L553A hERG1 subunits in a concatenated tetramer. (F) Plot of τdeact measured at −120 mV as a function of the number of WT subunits contained in a concatenated tetramer (n = 4–10). *P < 0.05; **P < 0.01; †P < 0.001 (one-way analysis of variance) compared with WT4 channels.

