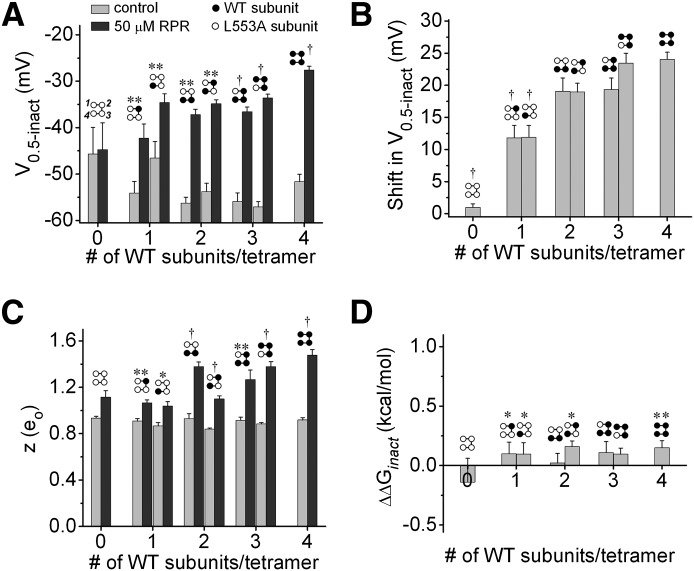
Fig. 7.
Effects of 50 µM RPR on parameters of inactivation of concatenated hERG1 tetramers. (A) Plot of V0.5inact versus the number of WT subunits contained within a concatenated tetramer. Control versus 50 µM RPR: **P < 0.01; †P < 0.001. (B) Shift in V0.5inact induced by RPR plotted as a function of the number of WT subunits contained in a concatenated tetramer. †P < 0.001 compared with WT4 channels (one-way analysis of variance). (C) Plot of equivalent charge (z) before and after 50 µM RPR versus the number of WT subunits contained within a concatenated tetramer. Control versus 50 µM RPR: *P < 0.05; **P < 0.01; †P < 0.001. (D) Plot of ΔΔG [= zFV0.5inact (50 µM RPR) − zFV0.5inact (control)], versus number of WT subunits contained in a concatenated tetramer. *P < 0.05; **P < 0.01 (paired t test). n = 4–6 for all panels.

