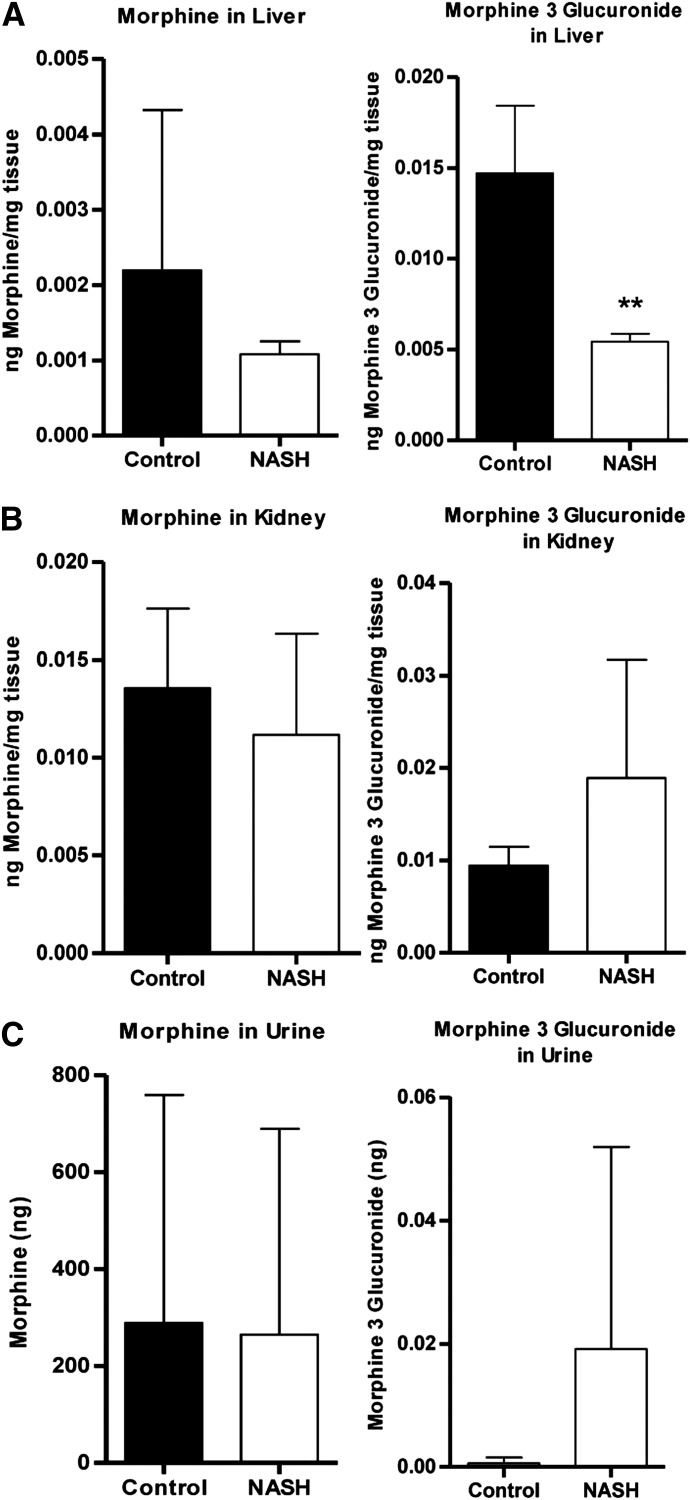
Fig. 4.
Hepatic, renal, and urinary levels of morphine and M3G. Levels of morphine (left) and M3G (right) in terminal liver (A) and kidney (B) and cumulative urine (C) were determined after intravenous administration of 2.5 mg/kg morphine to control and NASH rats. Graphs represent means ± S.D. **P ≤ 0.01 (t test).

