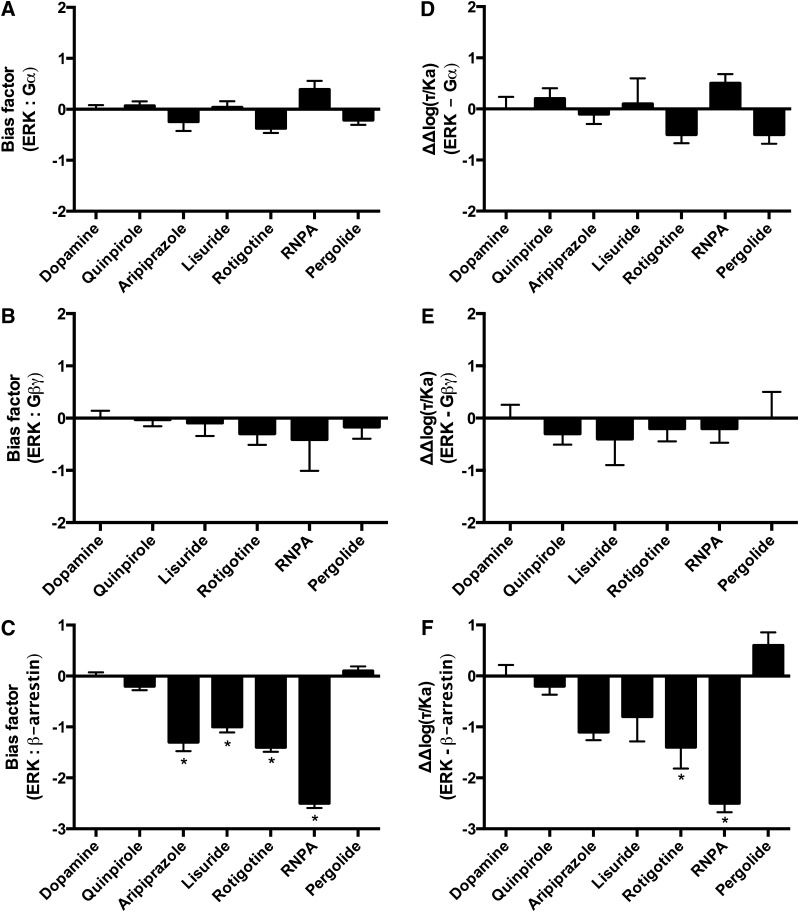
Fig. 6.
Bias analyses using the equiactive comparison and transduction coefficients of ERK phosphorylation in comparison with effectors of the D2R. (A) Equiactive comparison of ERK phosphorylation and Gαi/o activation. (B) Equiactive comparison of ERK phosphorylation and Gβγ activation. (C) Equiactive comparison of ERK phosphorylation and β-arrestin recruitment. (D) Analyses using the transduction coefficients of ERK phosphorylation in comparison with Gαi/o activation. (E) Analyses using the transduction coefficients of ERK phosphorylation in comparison with Gβγ activation. (F) Analyses using the transduction coefficients of ERK phosphorylation in comparison with β-arrestin recruitment. Dopamine was used as the reference compound for all the analyses. Positive values indicate bias for ERK phosphorylation; negative values indicate bias for the immediate D2R effector under analysis. Data represent the average and S.E.M. of at least three independent experiments. *P < 0.05.

