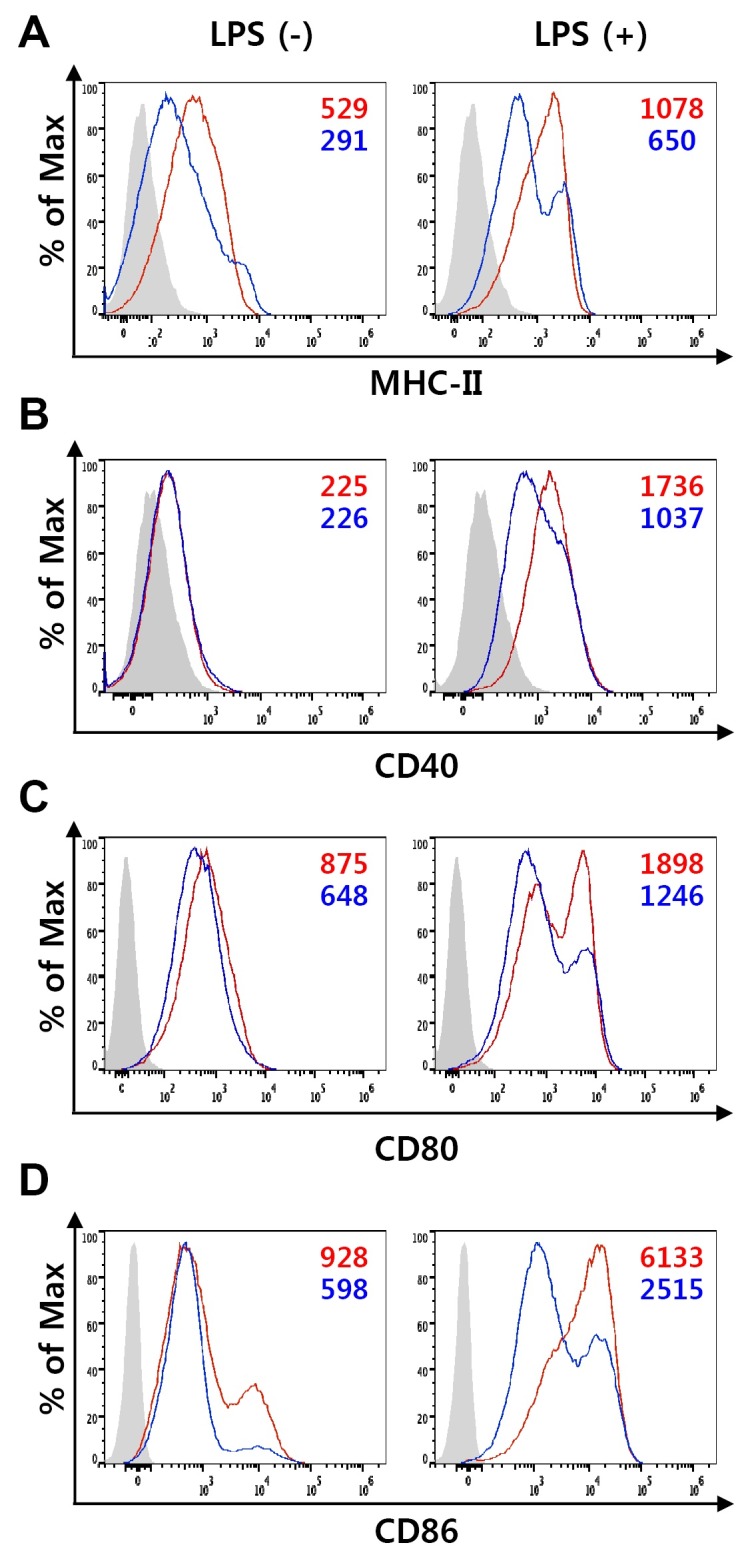
Fig. 1. The effect of TvSP on the expression of surface molecules on BMDC. DCs were differentiated with GM-CSF from BM precursors in the absence or presence of TvSP. On day 10, DCs were treated with 100 ng/ml LPS for 24 h to induce maturation, and expression of MHC-II (A), CD40 (B), CD80 (C) and CD86 (D) was analyzed by flow cytometry. Isotype controls are shown as shaded histograms, control BMDCs are shown as red lines, and TvSP-treated BMDCs are shown as blue lines. Mean fluorescent intensity (MFI) values are indicated with corresponding colors. Results are representative of more than three independent experiments.

