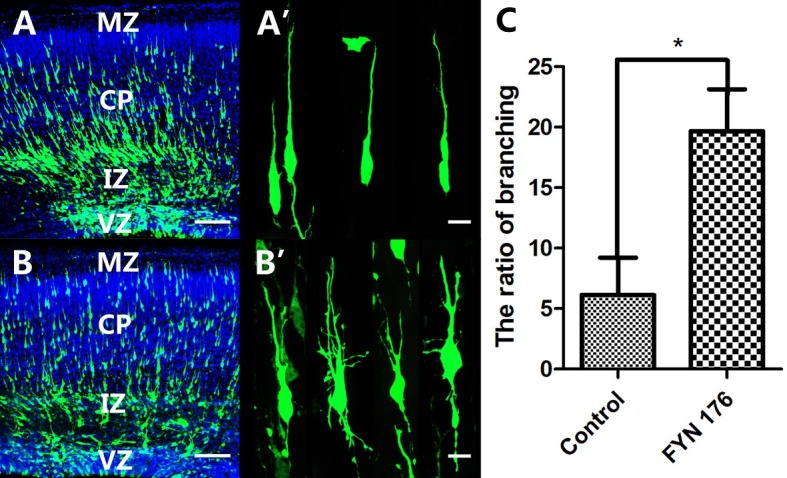
Fig. 3. Expression of FynR176A mutant induced the branching of cortical neurons. The brains were transfected with GFP or FynR176A at E15.5 and analyzed at E18.5. (A, A’) Normal morphology of migratory neurons in the GFP control group. (B, B’) Branching of cortical neurons in the FynR176A group. (C) Ratio of neurons with branches in the FynR176A mutant group compared with the GFP control group. Bars represent means ± standard deviation (*P < 0.05). (A, B) Scale bar = 100 μm, (A’ and B’) Scale bar = 10 μm.