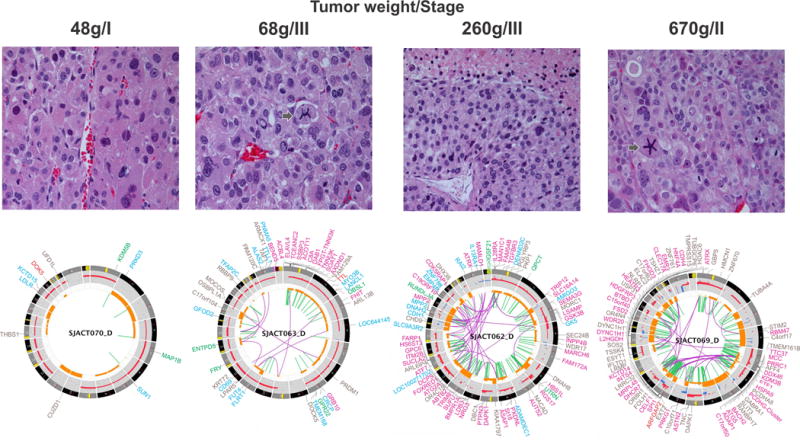
Figure 3.

Histopathological and genomic features of TP53-R337H associated ACTs. All tumors had a high mitotic rate (>5 per 50 high-power fields, H&E, 400X). Histology showed a vague nested and trabecular pattern with occasional unpatterned cellular sheets of variable size. Three cases (SJACT063, SJACT062 and SJACT069) had a high nuclear grade and marked cellular pleomorphism. SJACT070 showed occasional enlarged hyperchromatic nuclei with one or more prominent nucleoli. Necrotic cells and atypical mitotic figures (arrow) are identified in SJACT63 and SJACT69. Accumulation of genomic alterations illustrated by the Circos plots (bottom panels) paralleled an increase in tumor weight and correlated with a more aggressive tumor phenotype (Group 1 vs Group 2). Note: labels for gene disrupting SVs (SJACT063 and SJACT062) and non-coding mutations (SJACT069) were removed from the Circos plots.
