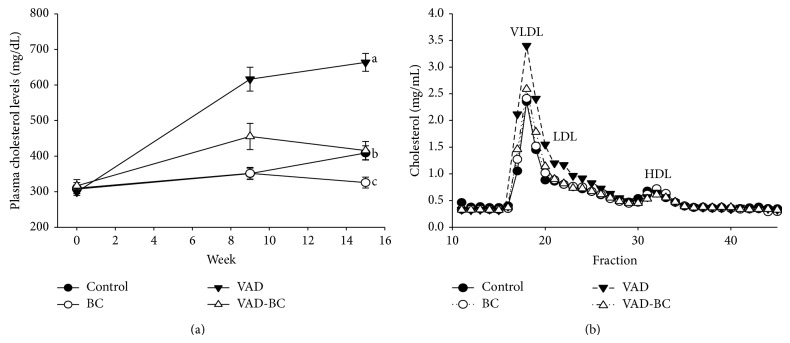
Figure 3.
Plasma cholesterol concentrations. Plasma cholesterol concentrations (a) and lipoprotein cholesterol content (b). Mice fed chow or vitamin A-deficient diet with or without βC after 15 weeks of treatment. VAD significantly increased plasma cholesterol concentrations due to increased levels of non-HDL cholesterol. Values are means ± SE, n = 15-16. a, bWithin the graph, means without a common letter differ, P < 0.05. Dunaliella treated group (BC); vitamin A-deficient diet group (VAD); vitamin A-deficient diet fortified with Dunaliella group (VAD-BC).

