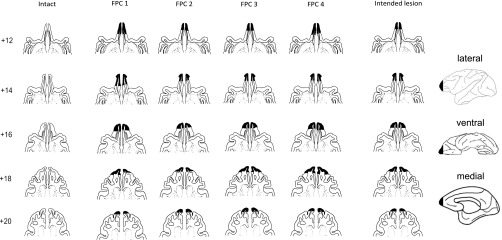
Fig. 1.

Drawings of intended and actual extents of the FPC lesion and histological verification. The intended lesion extent is shown on the far right in drawings of lateral, ventral, and medial surfaces, as well as in a series of drawings of horizontal sections. The sections on the left (one column per FPC-lesioned animal and one intact animal on the far left for comparison) show the actual extent of the lesions, as evident from the horizontal stained sections presented in Fig. S1. Numbers represent the approximate distance in millimeters above the interaural plane.
