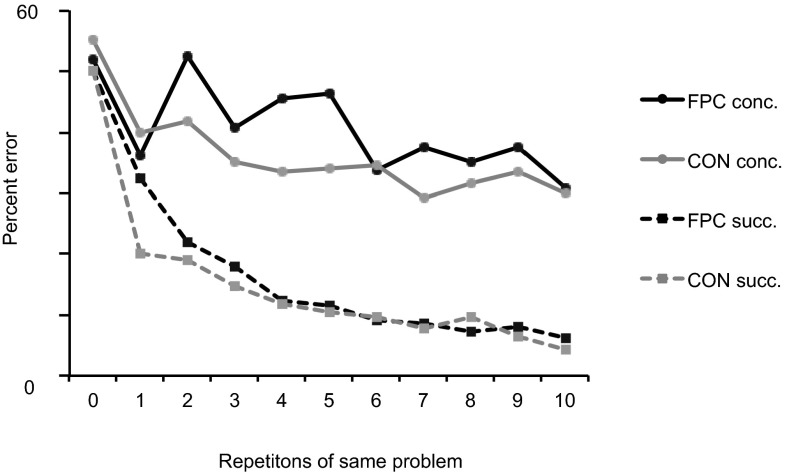
Fig. 3.
Comparison of learning rate for concurrent vs. successive discrimination learning tasks. Mean postoperative error rates for the CON group and FPC-lesioned group averaged across two 10-problem sets of concurrent discriminations and across many instances of 10-trial repetitions of successively presented single problems are depicted. In both cases, the error rate is plotted for the first 10 choices made to individual problems, choices that were in successive trials (succ.) in the single problem learning task but were separated by the intervening problems in the concurrent learning task (conc.). In the concurrent discrimination learning task, the repetition corresponding to zero is the first presentation of a problem to which the animals necessarily have to guess (hence, averaging around 50%). In the successive task, the repetition corresponding to zero is the forced response phase to S+ and S−, where no choice is actually made between S+ and S−; hence, we plot the data at precisely 50% (chance) to facilitate visual comparison between the data from both tasks.

