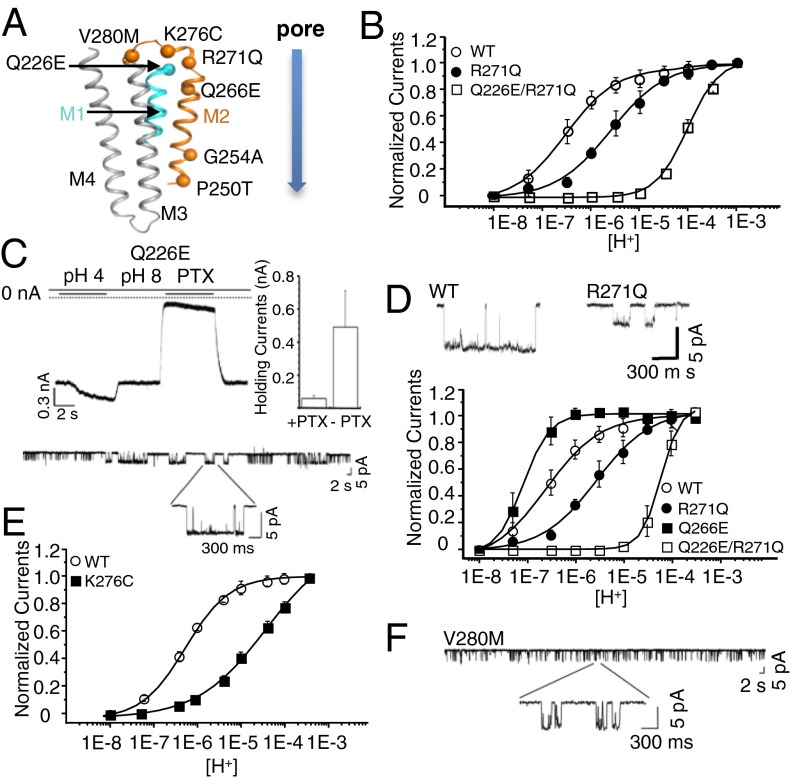
Fig. 4.
Phenotypes of the Q226E, Q266E, R271Q, K276C, and V280M mutants on Lily. (A) Cartoon representation of a Lily subunit with the Cα of mutated residues shown as spheres. (B) Normalized dose–response curves in the whole-cell configuration. Lower traces show single-channel recording (−60 mV and pH 6.0) of outside-out patches for WT and R271Q. (C) Sample trace for Q226E mutant showing the leak current observed at pH 8.0, the proton-elicited current, and the inhibition of the leak current by 100 μM picrotoxin (PTX) (quantified in the bar graph where error bars represent ±SD). Lower panel shows single-channel recording (−60 mV and pH 8.0) of outside-out patches of Q226E. (D) Dose–response curves recorded in the whole-cell configuration. (E) Dose–response curves recorded in the whole-cell configuration. (F) Single-channel recording (−60 mV and pH 8.0) of outside-out patches for the V280M mutant.

