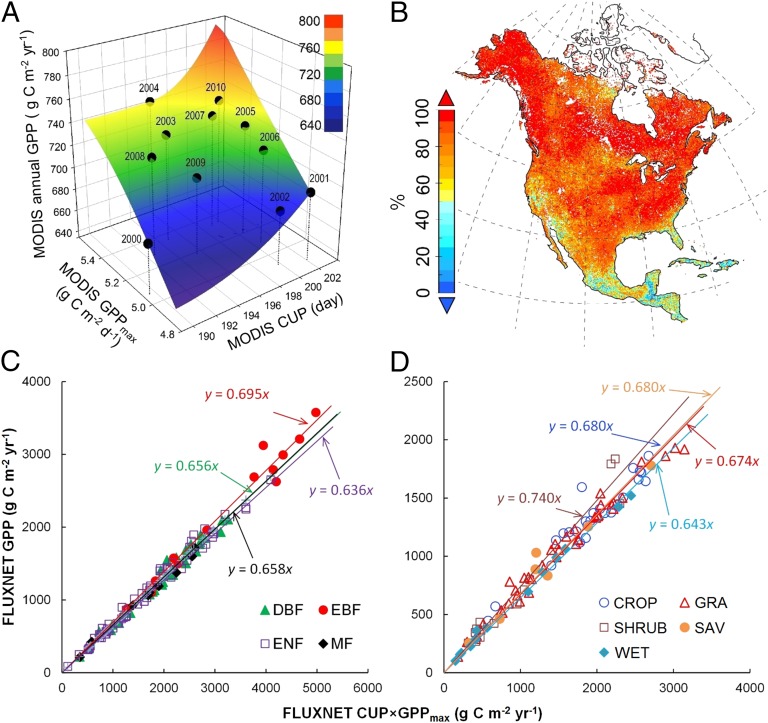
Fig. 1.
Joint control of the temporal variability of satellite-derived annual GPP and the spatial variability of FLUXNET annual GPP by CUP and GPPmax. (A) The temporal variability of GPP in North America from 2000 to 2010 can be better understood by splitting annual GPP into GPPmax and CUP. The flat color interpolated surface reflects a good relationship between annual GPP and GPPmax × CUP (R2 = 0.95, P < 0.001). Vertical lines were added to improve readability. (B) Contribution of GPPmax × CUP to GPP temporal variability over 2000–2010. The contribution in each grid cell was derived from the R2 in the linear regression analysis between GPP and GPPmax × CUP. C and D show relationships between GPP and GPPmax × CUP across FLUXNET sites in forest and nonforest biomes, respectively. Each data point in C and D represents one flux site with average data over different years. CROP, cropland; DBF, deciduous broadleaf forest; EBF, evergreen broadleaf forest; ENF, evergreen needleleaf forest; GRA, grassland; MF, mixed forest; SAV, savanna; SHRUB, shrubland; WET, wetland.

