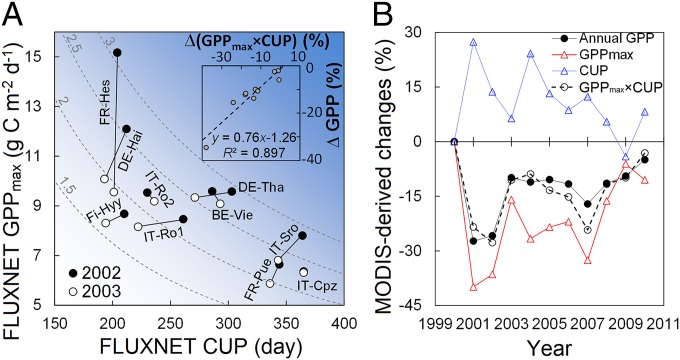
Fig. 2.
Applications of the convergence of α (the ratio between annual GPP and GPPmax × CUP) to explain GPP response to and recovery from disturbances. (A) Determination of the annual GPP reduction during the European heatwave in 2003 (12) by GPPmax and CUP. The dashed hyperbolic curves represent constant values (shown near the curves) of GPPmax × CUP (kilograms C meter−2 year−1), and the darker background blue color means a larger GPPmax × CUP. Inset shows the dependences of the relative changes in annual GPP (ΔGPP; percentage) in 2003 from those in 2002 on the relative changes in GPPmax × CUP [Δ(GPPmax × CUP); percentage; black circles). The ten sites are: BE-Vie (Vielsalm, Belgium), DE-Hai (Hainich, Germany), DE-Tha (Tharandt, Germany), Fi-Hyy (Hyytiala, Finland), FR-Hes (Hesse Forest- Sarrebourg, France), FR-Pue (Puechabon, France), IT-Cpz (Castelporziano, Italy), IT-Ro1 and IT-Ro2 (Roccarespampani, Italy), IT-Sro (San Rossore, Italy). Detailed information about each FLUXNET site can be found in SI Appendix, Fig. S9 and Table S1. (B) Contrasting dynamics of GPPmax and CUP after an extensive wildfire in the Black Hills National Forest in South Dakota. The data were extracted from a burned 0.1° × 0.1° grid cell (43.85° N, 103.95° W) (original data are plotted in SI Appendix, Fig. S2). The ratio α was close to 0.62 during the 11-y span (SI Appendix, Fig. S10).

