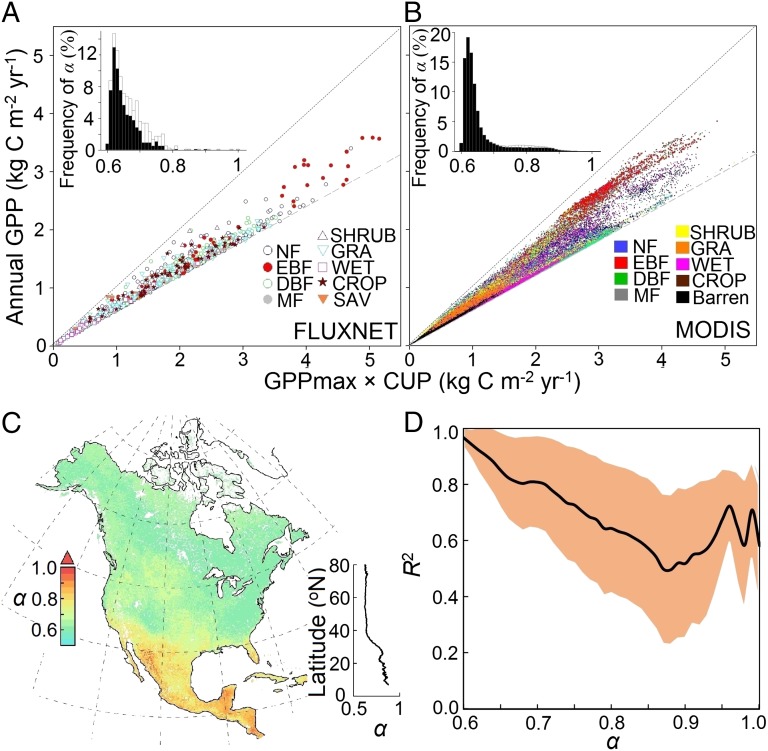
Fig. 3.
The relationship between annual GPP and the product of CUP and GPPmax (i.e., α) from FLUXNET and satellite-derived data. The relationship between annual GPP and CUP × GPPmax is shown across (A) all FLUXNET site-years and (B) all 0.1° × 0.1° land grids in North America. C shows spatial distributions of satellite-derived α, and D shows the relationship between α and the explanation of GPPmax × CUP on temporal variability of annual GPP (R2) (Fig. 1B) in North America. A, Inset and B, Inset show the relative frequency distribution of estimated α from all FLUXNET site-years and MODIS GPP data, respectively. The white bars are data from tropical and subtropical climate (including Mediterranean) zones and site-years with multiple GPP peaks, whereas the black bars are data from the rest of the site-years. C, Inset shows the latitudinal pattern of α with a 0.1° interval. CROP, cropland; DBF, deciduous broadleaf forest; EBF, evergreen broadleaf forest; GRA, grassland; NF, needleleaf forest; MF, mixed forest; SAV, savanna; SHRUB, shrubland; WET, wetland.

