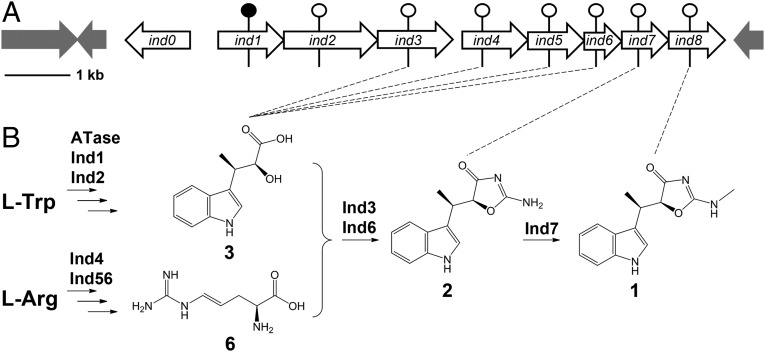
Fig. 1.
Indolmycin biosynthetic gene cluster and overall pathway. (A) Indolmycin biosynthetic gene cluster. The black circle indicates the gene was subjected to in-frame deletion, and white circles indicate insertional inactivation. (B) Proposed indolmycin biosynthetic pathway based on this study. Dashed lines indicate the major accumulated metabolite from each gene-inactivation mutant.

