Fig. 2.
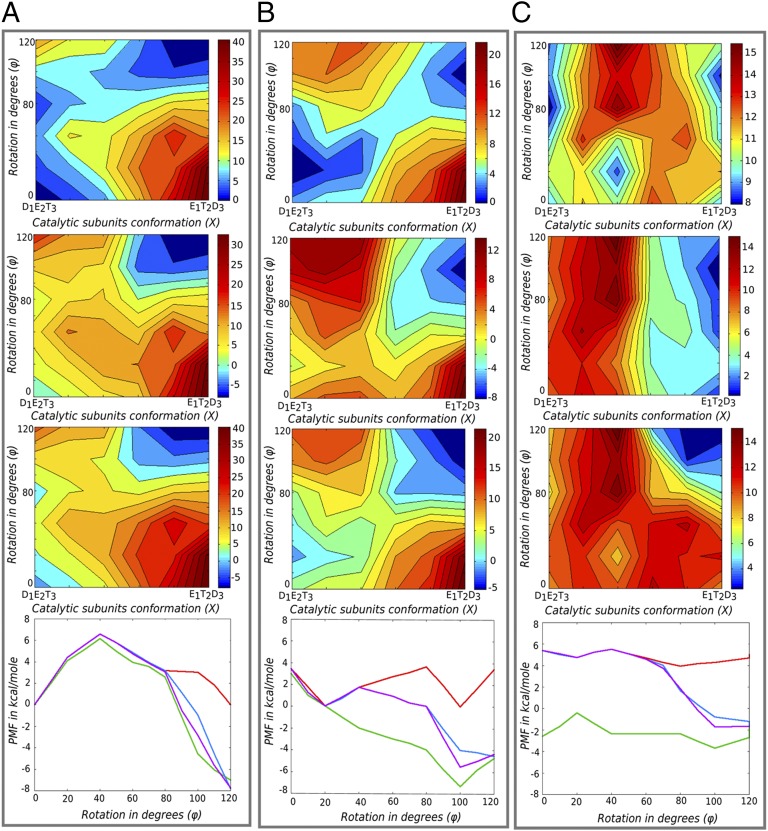
Converting the conformational landscape to torque. A–C show 120° electrostatic free energy maps for (A) the WT system, (B) the all-alanine γ-system, and (C) the all-glycine γ-system. For each column, Top panels show the surfaces without the addition of the chemical energy, Upper Middle panels show the surfaces when the chemistry is added to all ϕ-values starting at X = 0.6, and Lower Middle panels show the surfaces when the chemistry was added at the catalytic dwell (assuming it occurs at ϕ = 80°) and at X = 0.6. Another third option of adding chemistry was also considered where half of the chemical energy was added to ϕ = 80° and X = 0.6 and then the rest was added in steps between [ϕ = 80° to ϕ = 120°] and [X = 0.6 to X = 1.0] (surfaces not shown). Bottom panels present the PMFs obtained by MC simulations over the surfaces without chemistry and the surfaces with three options of distributing the chemical energy as mentioned above. The PMFs in red are for surfaces without chemistry, those in green are for the surfaces in Upper Middle panels, and those in blue and magenta are for the surfaces of Lower Middle panels and the third option not shown in this figure.

