Fig. 2.
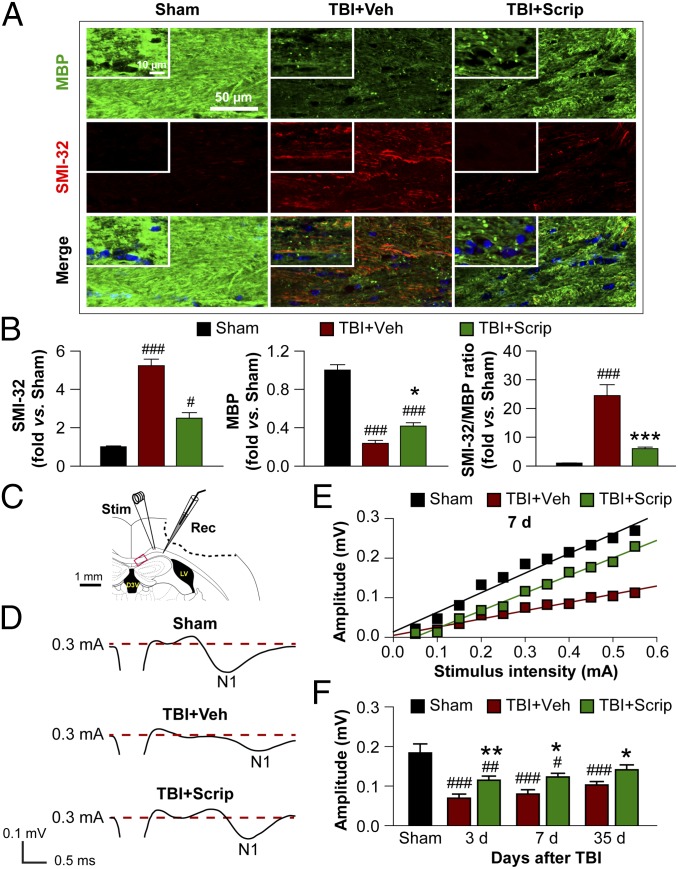
Long-term preservation of white matter after TBI is promoted by Scriptaid. (A) Double immunofluorescent staining for dephosphorylated neurofilament protein (SMI-32) and MBP in the ipsilesional CC at 35 d after TBI or sham treatment. Nuclei are labeled with DAPI (blue). (Insets) High-power images. (B) Degree of WMI, expressed as the fold increases of SMI-32, fold decreases of MBP, and the ratio of SMI-32 to MBP. (C) Illustration of the CCI lesion (dashed line) and regions for immunohistochemistry and electron microscropy (red box). Stimulating and recording electrodes were positioned at the CC as shown to measure the evoked CAPs. (D) Representative traces of the evoked CAPs in the CC (stimulus, 0.3 mA; 0.48 mm lateral to the stimulating electrode) at 7 d post-TBI. (E) Signal conduction along nerve fibers, as measured by the amplitude of the N1 component of the CAPs in response to increasing stimulus strength (0.05–0.55 mA) at 7 d post-TBI. (F) N1 amplitude in response to a 0.3-mA stimulus at 3, 7, and 35 d post-TBI. Shown are the mean ± SEM values from six mice per group. #P ≤ 0.05; ##P ≤ 0.01, ###P ≤ 0.001 vs. sham; *P ≤ 0.05, **P ≤ 0.01, ***P ≤ 0.001 vs. TBI + vehicle.

