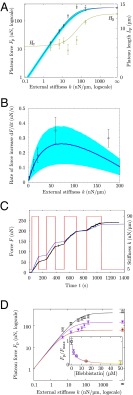
Fig. 2.
Predictive modeling of the stiffness-dependent cell mechanical response. (A) The force and cell length at equilibrium are adapted to the stiffness of the environment up to a maximum force at high stiffness, and for vanishing stiffness, there is a well-defined equilibrium length [independent of microtubules (Fig. S6)]. Circles show experimental results (13) for force (black) and length (green). The black line shows the force predicted by the 3D model. The green line shows the length predicted by the 3D model. The blue curve and shaded area show the force and confidence interval in the 1D model. Two of four parameters of the model were adjusted in this plot using the force at infinite stiffness and the length at zero stiffness. (B) During the transient part of the experiment, the rate of loading of the cell is adapted to the stiffness of the environment. Boxes show experimental results (13). The blue curve and shaded area show the force and confidence interval in the 1D model. One parameter of the model is fitted in this plot, and the last one is adjusted on Fig. 4A. (C) Instantaneous adaptation to a change of the microplate stiffness k. The red line shows stiffness imposed using a feedback loop. Black dots show the force measured (14). The blue line shows the 1D model prediction of force using the stiffness changes imposed in the experiment (red line) and the four parameters obtained in A and B without any additional adjustment. (D) Blebbistatin treatment modifies the contractility set point but preserves the mechanosensitivity. (Inset) The plateau force recorded experimentally for (○) decreases with the dose of blebbistatin. When decreasing the contractility parameter of the model by the inhibitory factor of blebbistatin, the model predicts these observations (SI Text, S3.7). Depending on the contractility set point (control, □; model prediction, black line; 5 μM blebbistatin treatment, ▽; corresponding model prediction, purple line; model prediction for 15 μM blebbistatin treatment, red line), the mechanosensitivity is preserved as the force depends on k but with a shift in the saturation force at high stiffness and a different critical stiffness from which force saturates. Color codes blebbistatin concentration in both D and D, Inset.

