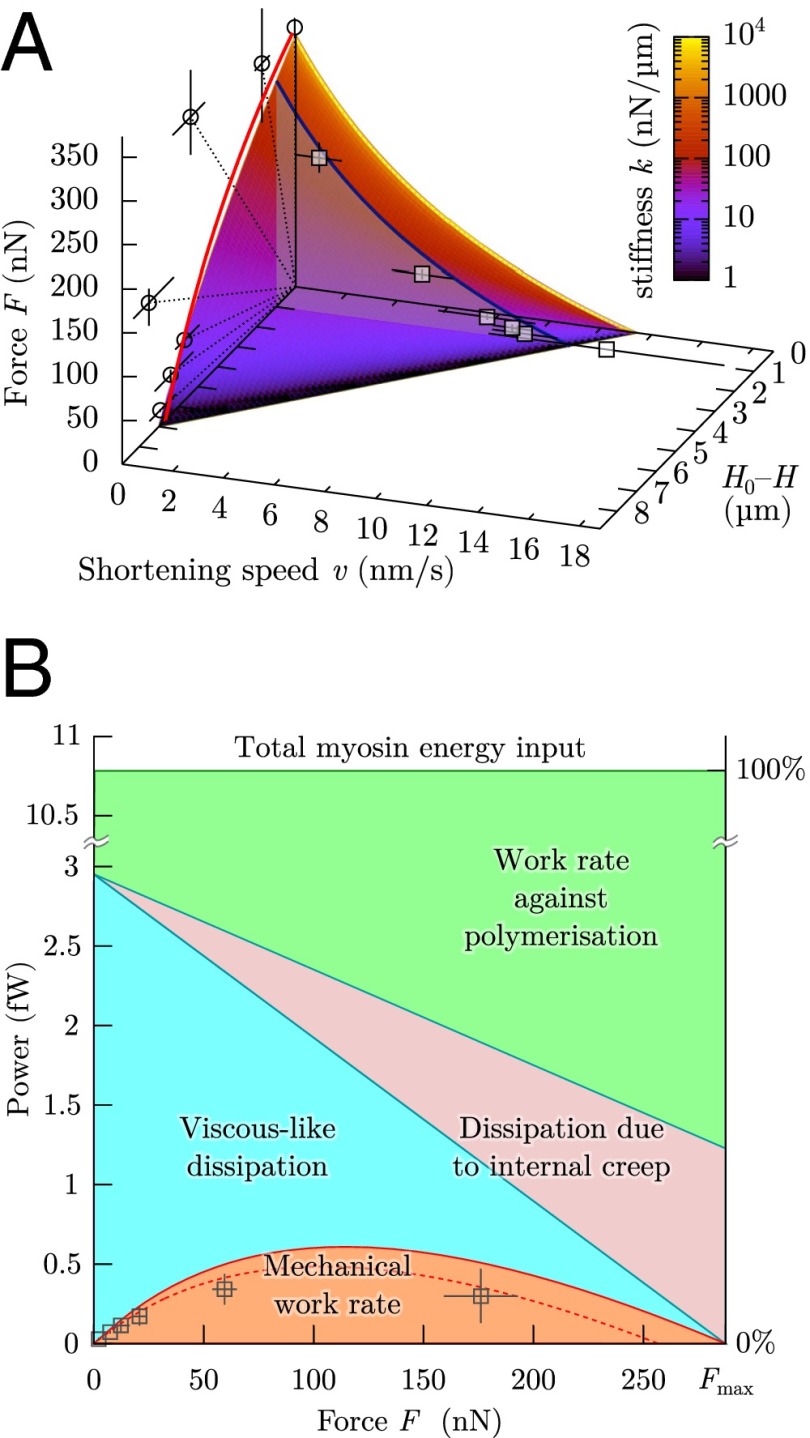
Fig. 4.
Liquid-like motor properties of cells. (A) The rheological model leads to a Hill-type Eq. 3, which matches quantitatively the experimental data both during loading (blue curve at , force velocity in 1D model; boxes, experiments) and at equilibrium (surface intercept with , 1D model; red curve, 3D model; circles, experiments). Dotted lines correspond to the force–distance relationship imposed by a given microplate stiffness k. Same parameters are used as in Fig. 2. (B) Power use in a microplate experiment as a function of the external load F: only a small part of the load-independent myosin power is being transmitted to the cell environment as mechanical power; the rest is dissipated internally or compensates the antagonistic role of polymerization. Boxes are the experimental results to be compared with the dashed line, which is mechanical power at . Solid lines correspond to . Same parameters are used as in Fig. 2.

