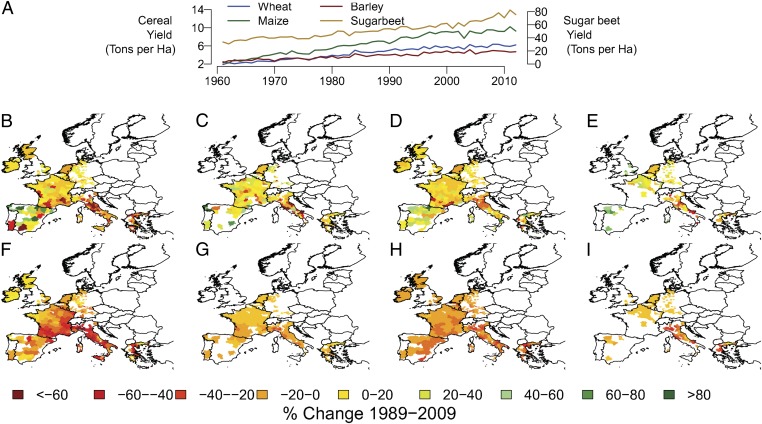
Fig. 1.
Patterns and time evolution of crop yields in Europe and the predicted impacts of climate trends. (A) Area-weighted yields of the four crops examined in this paper for the countries included in the study, 1960–2010 (SI Appendix, Table S1) (17). (B–E) Maps of the observed linear trend in yield in 1989–2009 for wheat (B), maize (C), barley (D), and sugar beet (E) (25). Maps of the expected change in yield based on growing-season temperature and precipitation trends in 1989–2009 (27, 28) and the yield response functions described by Moore and Lobell (8) (SI Appendix, Figs. S3 and S4) for wheat (F), maize (G), barley (H), and sugar beet (I). White shows areas not included in the study due to insufficient data.

